The AN-SOF Simulation Engine
AN-SOF: High-Precision Antenna Simulation & Modeling
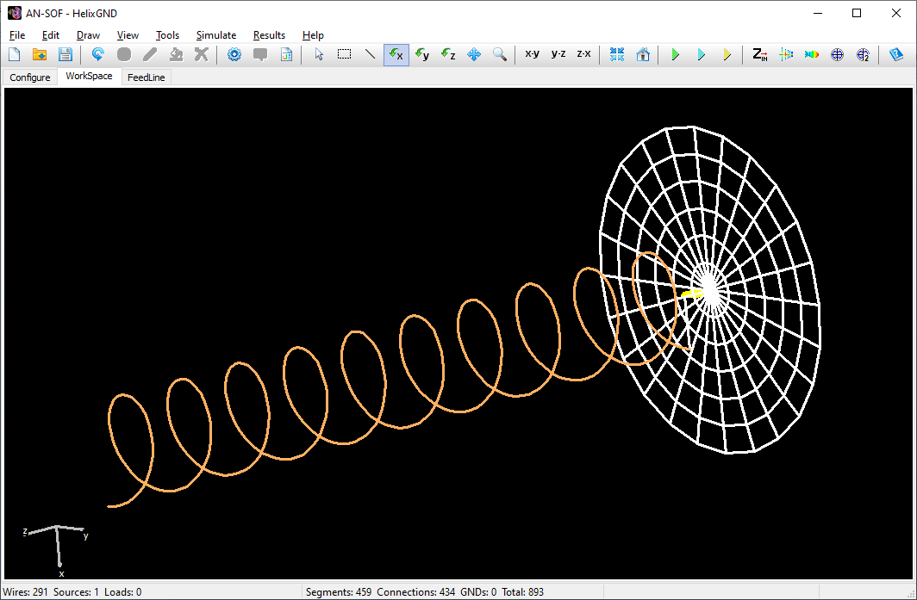
AN-SOF is a robust simulation engine designed for the modeling and analysis of complex antenna systems and radiating structures. It is powered by the Conformal Method of Moments (CMoM) with Exact Kernel, widely recognized as the most accurate numerical approach for modeling wire-based structures and curved geometries.
Modern CAD Interface & 3D Workflow
Experience a fluid design environment where you can model geometries directly using intuitive mouse-driven tools and precision dialogs. Our 3D workspace features full support for dynamic motion, rotation, and multi-axis zooming, allowing you to inspect every segment of your design with clarity.
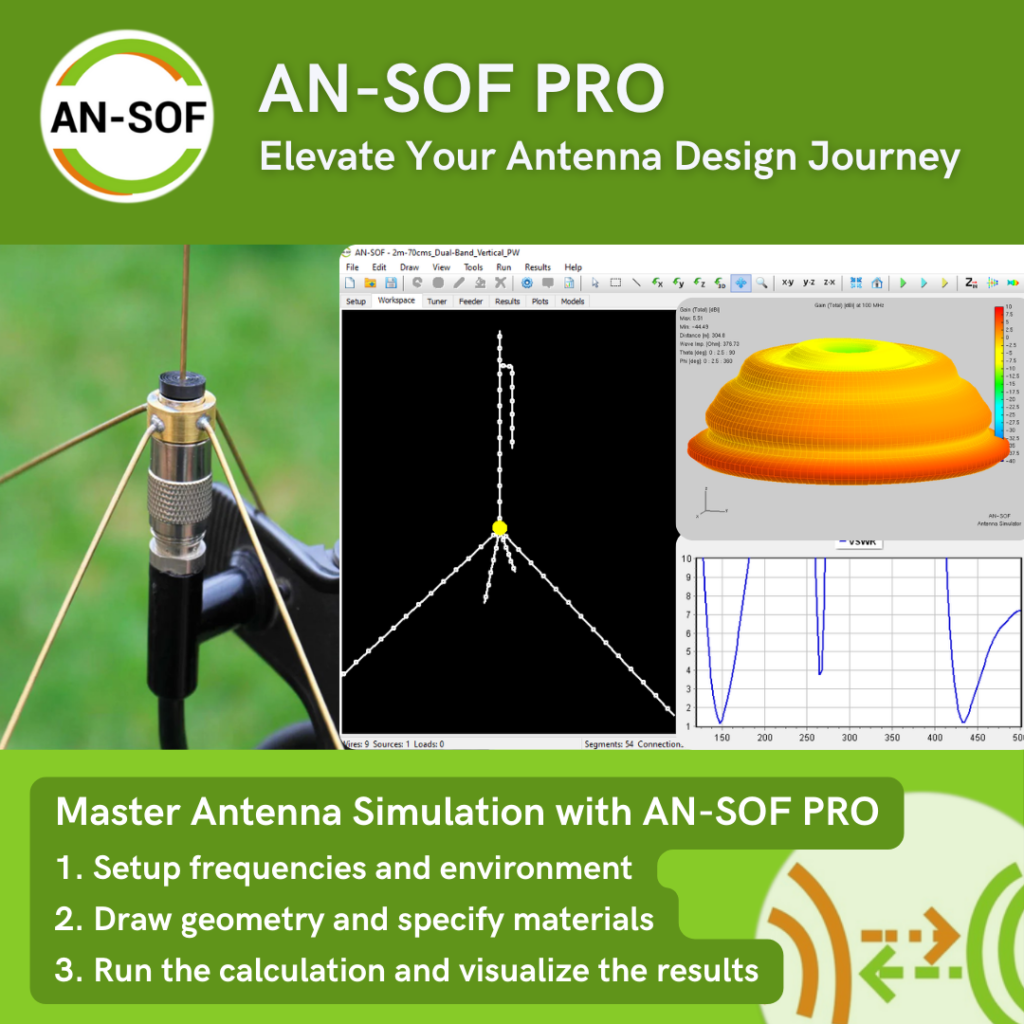
The Three-Step Simulation Workflow:
- Setup: Define your frequency range, environmental parameters, and desired output.
- Design: Construct your geometry, specify materials, and configure sources.
- Analyze: Run the simulation and visualize high-fidelity results instantly.
1. Setup

2. Design
3. Analyze
Comprehensive Output Data
Analyze transmitting and receiving antennas with laboratory-grade detail. AN-SOF delivers critical performance parameters as a function of frequency, including:
- Impedance & SWR: Input impedance and Standing Wave Ratio.
- Power Dynamics: Efficiency, radiated power, and power consumption.
- Radiation Metrics: Gain, directivity, beamwidth, and front-to-back ratio.
- Advanced Physics: Radar Cross Section (RCS) and full polarimetric field components (linear and circular).
The AN-SOF Competitive Edge
- Unrivaled Accuracy: Leverage the Exact Kernel to make informed design decisions based on high-fidelity simulation data.
- Streamlined Workflow: A professional, intuitive interface reduces the learning curve, moving you from concept to results faster.
- Architectural Versatility: Simulate antennas of virtually any size, shape, or configuration with a versatile numerical engine.
- Rapid Prototyping: Accelerate your R&D cycle by optimizing and simulating designs with high computational efficiency.
- Validated Success: Secure your project’s success by designing with the confidence of a precision-vetted simulation tool.
Integrated Application Ecosystem
AN-SOF includes a specialized suite of post-processing tools to visualize your results with professional clarity:
AN-XY Chart | AN-Smith | AN-Polar | AN-3D Pattern
Technical Resources
Knowledge Hub ↗
Technical Manual ↗
Project Benchmarks ↗
Video Tutorials ↗
White Papers & Research ↗
The AN-SOF Integrated Application Ecosystem
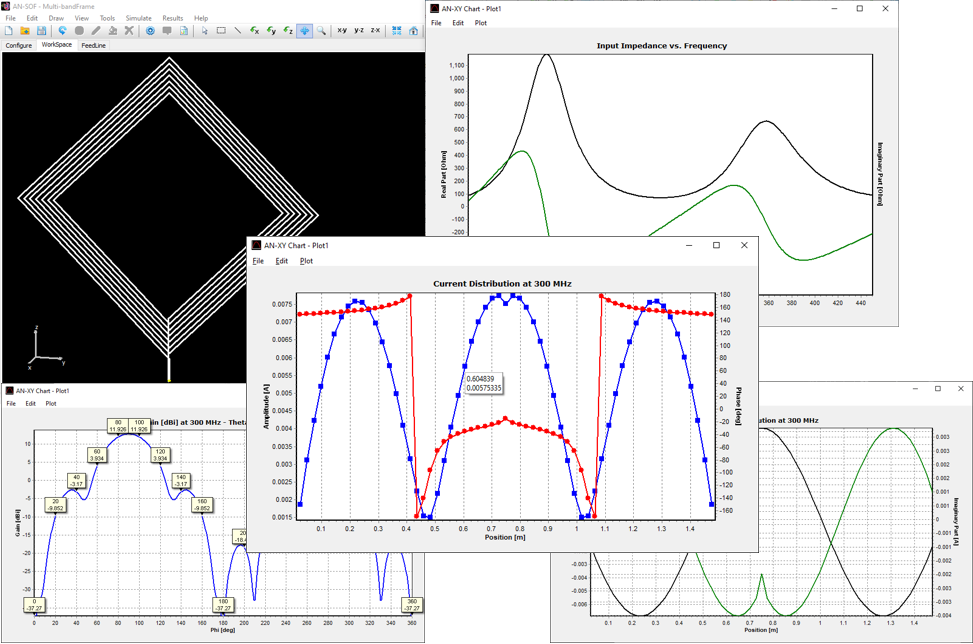
AN-XY Chart | High-Resolution 2D Analysis
Perform comprehensive spectral analysis with a robust 2D plotting engine. Use AN-XY Chart to visualize frequency-dependent parameters with laboratory precision, including:
- Network Parameters: Impedance, reflection coefficients, and SWR.
- Power & Efficiency: Radiated vs. consumed power and radiation efficiency.
- Radiation Metrics: Directivity, gain, and Radar Cross Section (RCS).
- Spatial Distributions: Plot current distribution along wire segments and near-field slices as a function of distance. Features include multi-unit support and dynamic 2D navigation (zoom/scroll) for detailed data inspection.

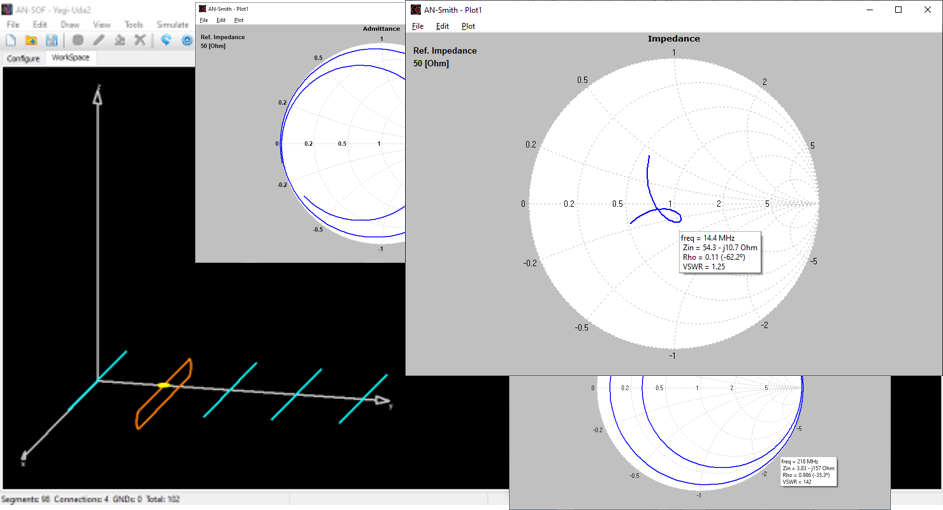
AN-Smith | Vector Network Analysis
Streamline impedance matching and network characterization. AN-Smith allows you to plot complex impedance or admittance curves directly on a high-fidelity Smith Chart.
- Interactive Data: Simply click any point on the trace to instantly retrieve frequency, complex impedance, reflection coefficient, VSWR, and S11.
- Archive & Compare: Save plots to independent files for side-by-side graphical analysis and design verification.

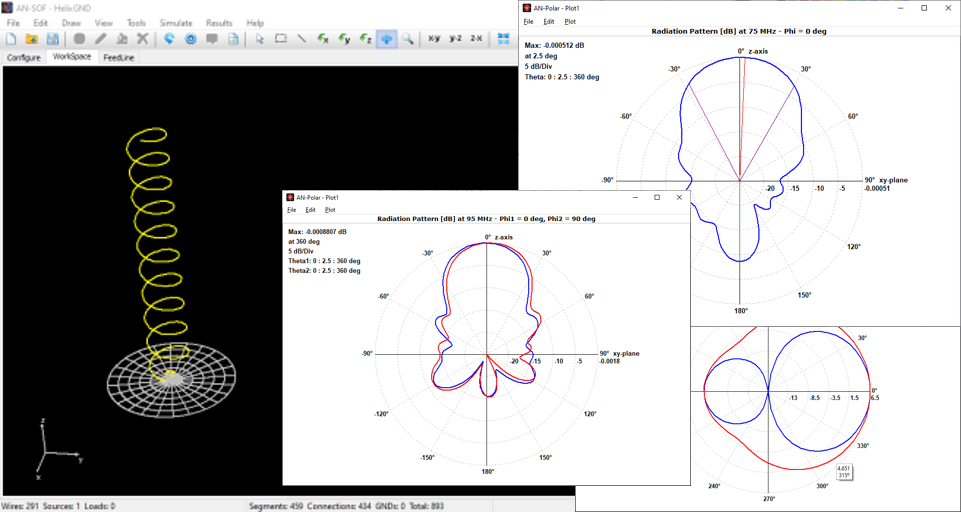
AN-Polar | Far-Field Characterization
Analyze the angular sensitivity of your designs with specialized polar diagrams. AN-Polar provides a clear view of radiation patterns across azimuth (horizontal) and zenith (vertical) planes.
- Automated Metrics: Instantly visualize the -3dB beamwidth, minimum/maximum radiation levels, and front-to-back ratio.
- Polarimetric Data: View power density, gain, and normalized patterns alongside linear and circularly polarized field components.
- Precision Reading: Click any point on the diagram for immediate access to radiated field values and RCS data.

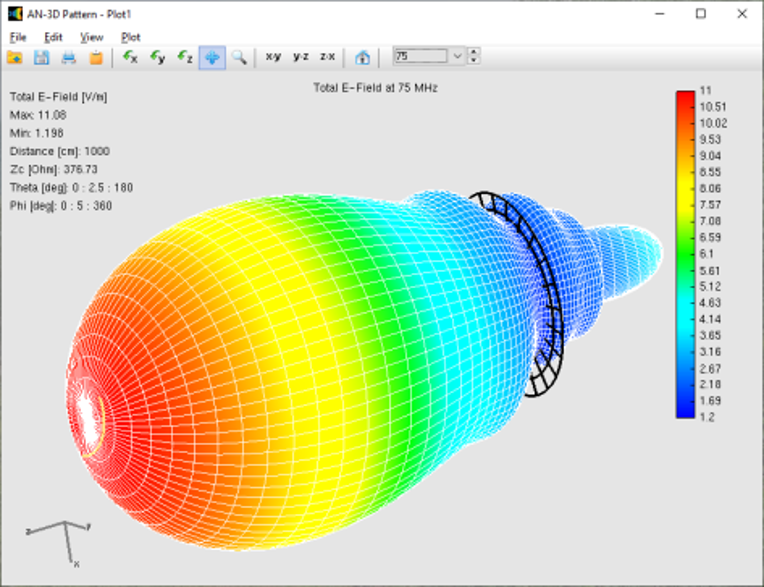
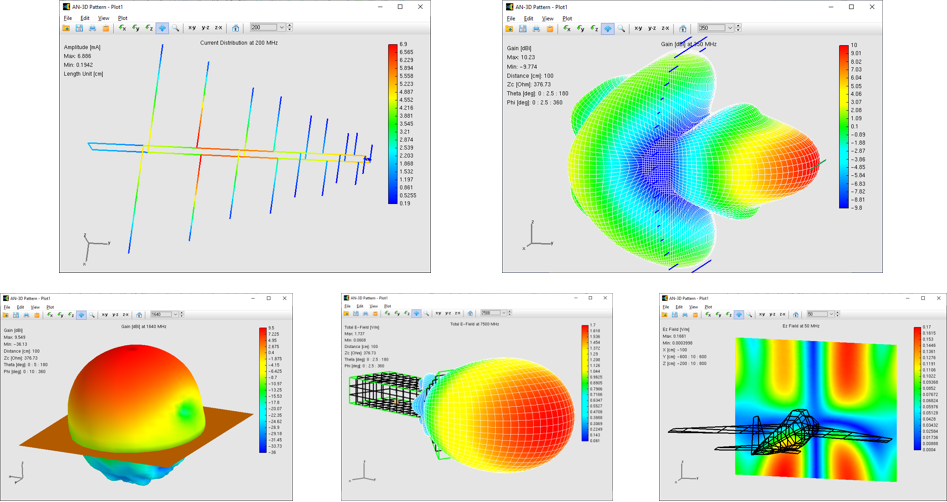
AN-3D Pattern | Volumetric Visualization
Gain total spatial awareness of your antenna’s performance with immersive 3D rendering. AN-3D Pattern utilizes colored mesh and surface mapping to visualize radiation lobes with professional clarity.
- Spatial Diagnostics: Superimpose 3D radiation patterns directly onto the antenna geometry to understand the relationship between physical structure and directional properties.
- Advanced Field Mapping: Display near-fields as volumetric color maps in Cartesian, cylindrical, or spherical coordinates.
- Current Intensity Maps: Visualize current distribution across the structure as a high-contrast colored intensity map.
- Full Control: Seamlessly rotate, pan, and zoom through complex 3D data with a high-performance rendering engine.
Experience Professional Precision: Start Your Trial
Read how industry experts have validated our numerical accuracy against established electromagnetic standards. View Technical Reviews →