Search for answers or browse our Knowledge Base.
Guides | Models | Validation | Book
AN-SOF Data Export: A Guide to Streamlining Your Workflow
Unleash the power of your AN-SOF simulations! This article explores the software’s data export features, enabling you to seamlessly transfer results to spreadsheets for further analysis, report generation, and clear communication of your antenna design findings.
Leveraging AN-SOF Data: From Simulation to Spreadsheet
The ability to effectively export data is crucial for post-processing simulation results and generating clear reports for colleagues. AN-SOF facilitates this process by allowing users to export data to comma-separated values (CSV) files. This format stores data in a tabular structure, readily compatible with popular spreadsheet programs like Microsoft Excel and Google Sheets.
Accessing and Exporting AN-SOF Data
AN-SOF provides a convenient way to export data for further analysis in spreadsheet software. The Export button becomes available adjacent to specific tables within the program’s Results menu. Here’s a breakdown of how to access and export data commonly used for antenna analysis:
1. Current Distribution:
- Select a wire object in your AN-SOF model.
- Navigate to the main menu and select Results > List Currents.
- Utilize the slider to choose a specific wire segment.
- Click on either the Current on Segment button to view a table of current along the segment at various frequencies, or the Input List button (enabled only if a source is present) to display the input impedance presented to the source connected to that segment (see Figure 1). Alternatively, the input impedance versus frequency of a transmitting antenna with a single input port can be shown quickly by clicking the List Input Impedances button on the toolbar. This avoids the procedure of selecting the wire segment where the source is placed.
- The Export button will be located next to the resulting table, allowing you to export the current data to a CSV file.
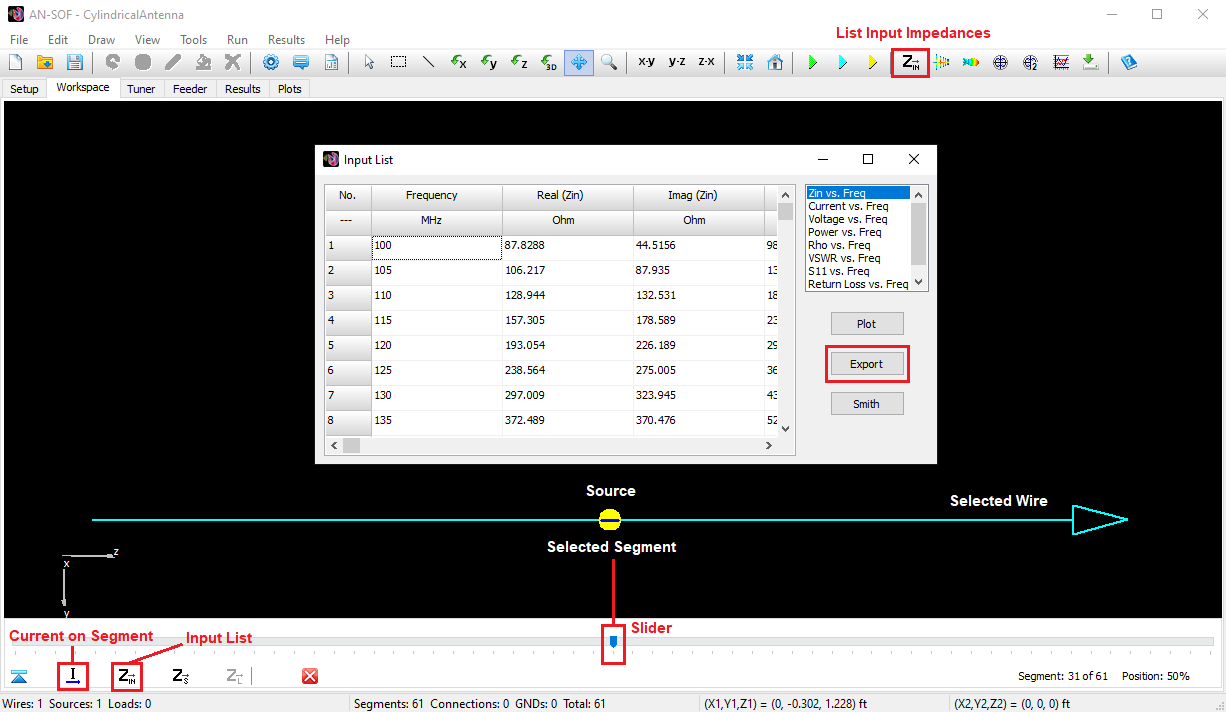
In Figure 1, the List Currents toolbar appears after selecting a wire in the AN-SOF model. The slider allows you to choose a specific segment for current analysis. The highlighted buttons (Current on Segment and Input List) access different current data. While this figure shows the Input List table, the input impedance versus frequency can also be obtained directly using the List Input Impedances button on the main AN-SOF toolbar.
2. Power Budget and Radar Cross Section (RCS):
- Access the table containing various parameters like input power, radiated power, efficiency, directivity, gain, front-to-rear/back ratios, EIRP (Effective Isotropic Radiated Power), and more, by navigating to Results > Power Budget/RCS. This table displays these parameters across the entire frequency range of your simulation. If an incident plane wave is used as excitation instead of a lumped source, the RCS results will be shown instead of the power budget.
- The Export button is situated beside this table, enabling you to export this comprehensive dataset for further analysis (see Figure 2).
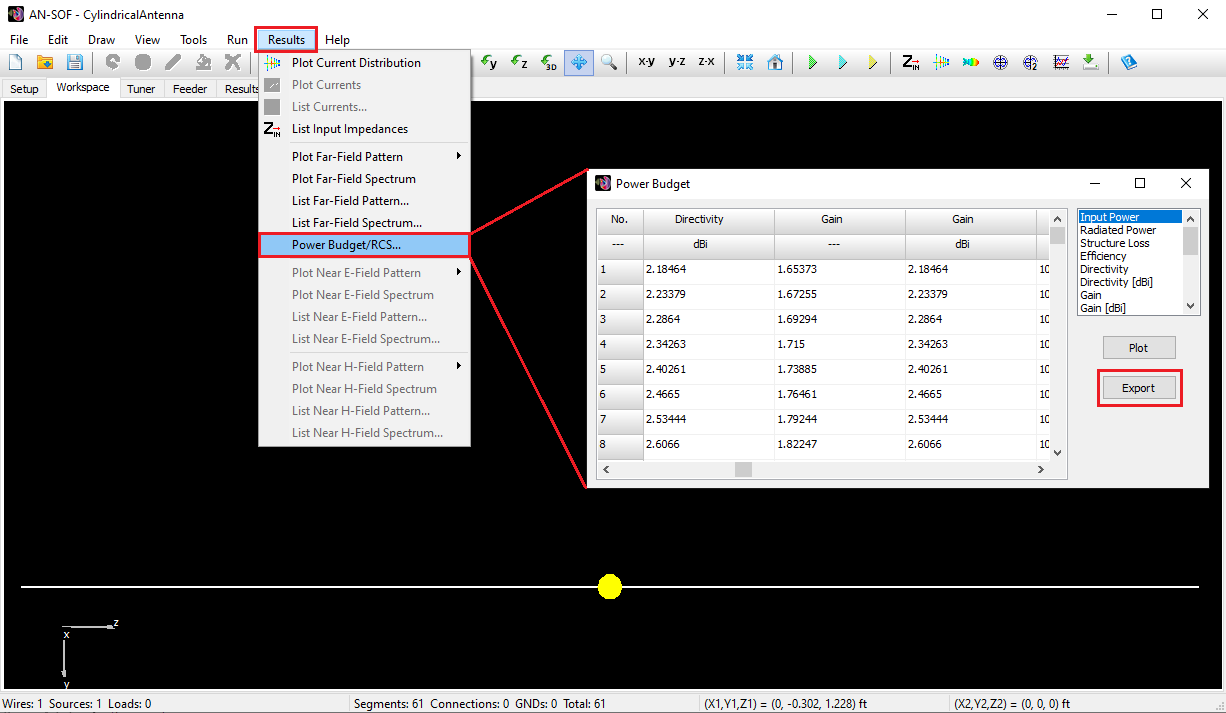
Figure 2 illustrates how to access the Power Budget/RCS data in AN-SOF. The Results menu option is highlighted, leading to the table displaying various parameters (like input power, radiated power, efficiency) versus frequency for your chosen simulation.
3. Far-Field Analysis:
- AN-SOF offers the ability to export both far-field patterns and spectrums. To export the far-field pattern (tabular data of the field strength for various directions at a chosen frequency), navigate to Results > List Far-Field Pattern.
- For the far-field spectrum (tabular data showing field strength variation across frequencies for a specific direction), use Results > List Far-Field Spectrum.
- In both cases, the Export button will be available next to the generated table, allowing you to export the far-field data to a CSV file.
4. Near-Field Analysis:
- Similar to far-field data, near-field electric (E-field) and magnetic (H-field) patterns and spectrums can be exported using the Export button.
- Access the desired near-field data through Results > List Near E-Field (H-Field) Pattern or Results > List Near E-Field (H-Field) Spectrum.
- The Export button will be positioned beside the resulting table, facilitating the export of near-field data to a CSV file for further processing.
Exporting Plots and Summary Results
AN-SOF provides multiple methods for exporting graphical data and summary tables:
1. Exporting from Plotting Applications:
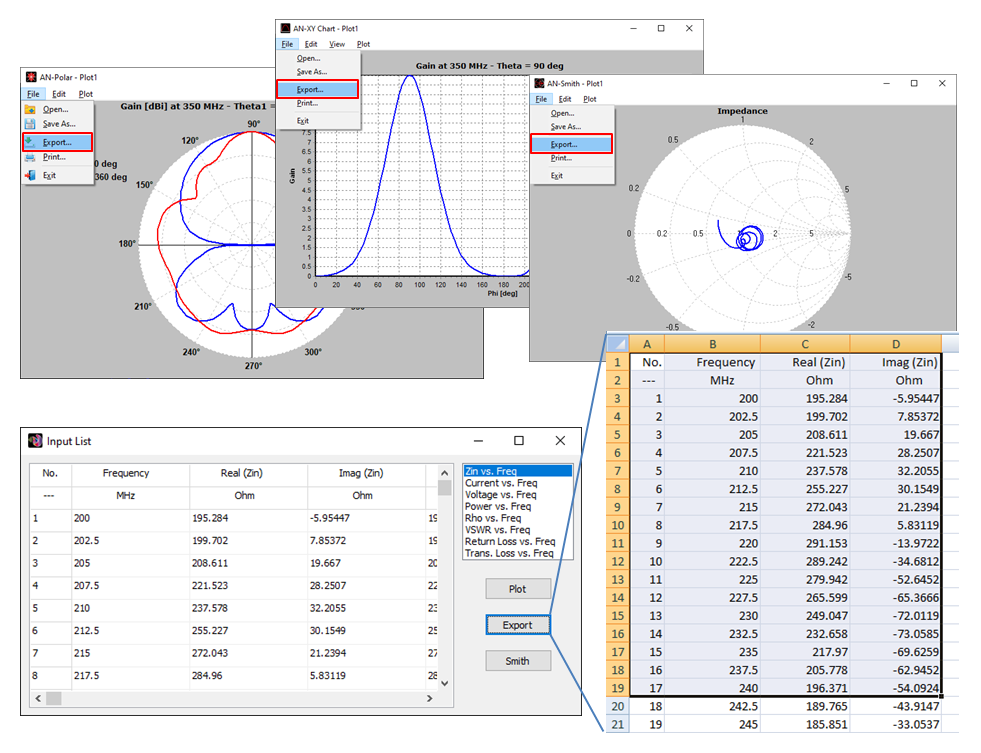
- After generating a plot using AN-XY Chart, AN-Smith, or AN-Polar, navigate to the application’s main menu and select File > Export. This will allow you to export the plot data as a CSV file for further analysis in spreadsheet software.
2. Copying Plots as Images:
- These plotting applications offer a “Copy Plot” option (Ctrl + C) within the Edit menu. Alternatively, access the File > Copy Workspace option in the AN-SOF main window. This functionality copies the displayed plot as a bitmap image to your clipboard. You can then paste this image (Ctrl + V) into various applications like Microsoft Word, PowerPoint, their Google equivalents, image editors, or email bodies.
3. Exporting Summary Results Table:
- The “Results” tab in the AN-SOF main window displays a summary table for transmitting antenna simulations across the frequency range. This table includes parameters like input impedance (Rin + j Xin), VSWR, reflection coefficient (S11 in dB), directivity (dBi), gain (dBi), efficiency, and front-to-rear/back ratios in both horizontal (H) and vertical (V) planes (see Figure 3).
- To export this table as a CSV file, locate and click the Export Results button on the toolbar.
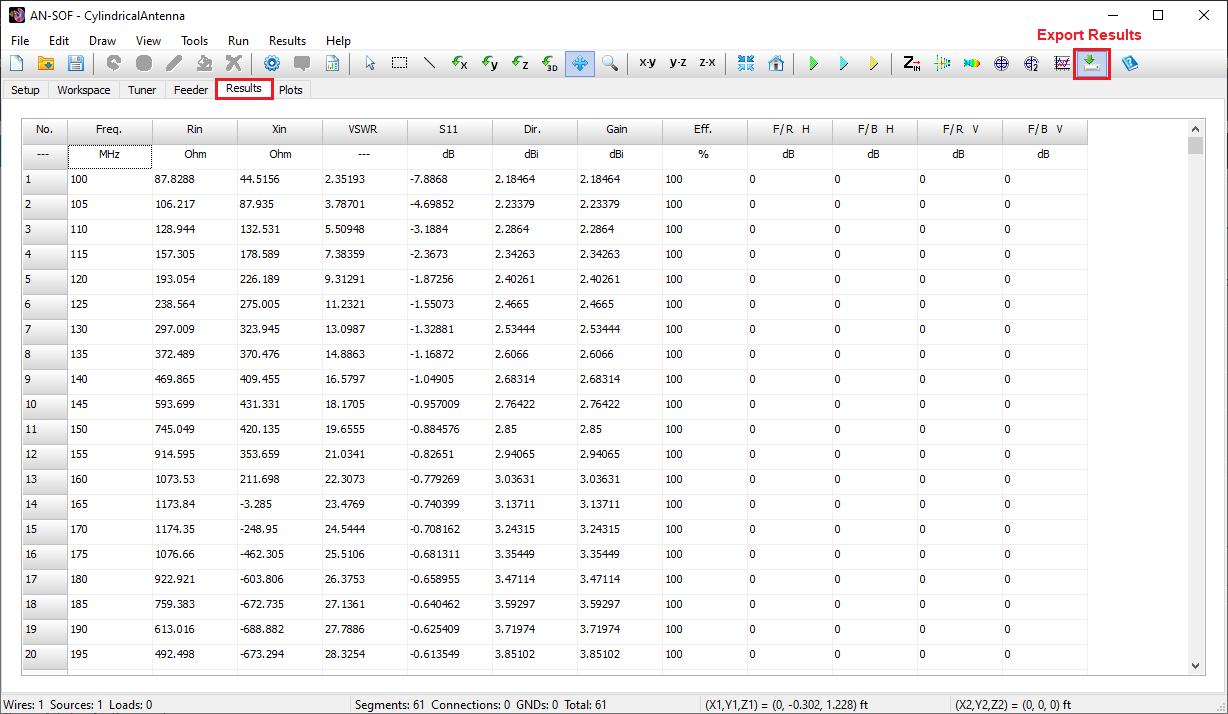
Figure 3 shows the Results tab in AN-SOF, which provides a summary table for key parameters of a transmitting antenna simulation across different frequencies. These parameters include input impedance, VSWR, reflection coefficient, directivity, gain, efficiency, and front-to-rear/back ratios. To export this table for further analysis in spreadsheet software, click the Export Results button on the main AN-SOF toolbar.
Conclusions
AN-SOF’s data export capabilities empower users to seamlessly integrate simulation results into their workflow. By exporting data to CSV files, users can leverage powerful spreadsheet software for further analysis, report generation, and data visualization. This functionality streamlines post-processing tasks and facilitates clear communication of simulation findings.