Search for answers or browse our Knowledge Base.
Guides | Models | Validation | Book
Simple Dual Band Vertical Dipole for the 2m and 70cm Bands
Discover the perfect balance: a simple dual-band vertical dipole, AN-SOF modeling, and real-world results. Elevate your ham radio experience.
In the October 2023 edition of Practical Wireless magazine, renowned columnist Keith Rawlings (call sign G4MIU) authored an article titled ‘Adapting a Simple 2m/70cm Vertical for Temporary Use,’ spanning pages 49 to 51. In this article, the author introduces a straightforward vertical dipole design tailored for the 2m and 70cm bands. We express our gratitude to Practical Wireless for generously permitting the replication of the results featured in Keith’s article, which we highly recommend for a comprehensive read. In addition to simulating his antenna design using AN-SOF Antenna Simulator, the author elaborates on the construction and real-world installation of his antenna, ingeniously creating a portable solution. We’d like to extend our appreciation to Keith for not only sharing the AN-SOF project files but also providing us with valuable measured data.

As articulated in Keith’s article, this antenna emerges as an optimal choice when confronted with spatial constraints, particularly when one seeks to engage in amateur radio activities. The antenna features a λ/4 vertical element with a strategically placed stub, making it dual-band capable. The author constructed this antenna using 1.5 mm diameter brazing rod as the primary material. For the 2m band, Keith added a pair of quarter-wave radial wires, and likewise, a corresponding pair for the 70cm band, which function as a ‘ground plane’. The feed point is situated at the beginning of the vertical element, just above the juncture where the four radials are connected. For precise model dimensions, we direct you to the Practical Wireless article, or you can readily access them by downloading the AN-SOF model by pressing the “Download Model” button beneath Figure 1.
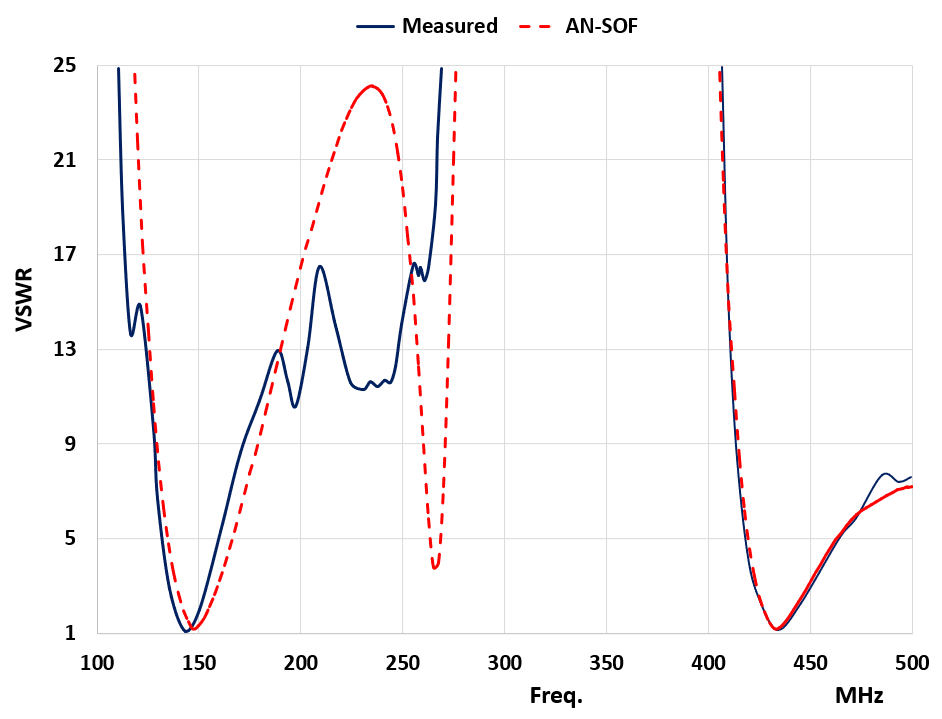
The primary objective of this article is to conduct a comparative analysis of the Voltage Standing Wave Ratio (VSWR) curve derived from simulation with the actual measured VSWR curve. This comparison will encompass the frequency range spanning from 100 to 500 MHz.
Figure 1, displayed above, offers a view of the antenna model within the AN-SOF workspace. The antenna is situated at a height of 240 inches above a real ground plane, featuring a ground conductivity of σ = 0.003 S/m and a dielectric constant of εr = 4, corresponding to a “Moderate” ground. To the right of Figure 1, at the top, you’ll find the radiation pattern at 145 MHz (the resonance frequency within the 2m band), while the radiation pattern at 433 MHz (the resonance frequency within the 70cm band) is presented at the bottom.
The AN-SOF model provided utilizes a segment density of 15 segments per wavelength of wire, computed based on the shortest wavelength within the sweep, corresponding to 500 MHz. With this segmentation density, the model comprises a total of 62 segments, including the connections between wires, contributing to the overall ‘segments’ count for calculation purposes. In Figure 1 on the left, you can visually identify this segmentation density on the antenna model, where each segment is depicted as the line connecting pairs of dots. Navigate to Tools > Preferences in the AN-SOF main menu and then choose the ‘WorkSpace’ tab and check the Show Segments option to display the segment density.
Figure 2, on the other hand, showcases the VSWR of the antenna plotted against frequency, represented by both measured (solid blue curve) and calculated (dashed red curve) data. The comparison reveals an outstanding level of agreement, particularly within the 70cm band. It’s crucial to note that achieving a model that aligns perfectly with experimental data across such a broad frequency spectrum is an intricate endeavor, and thus, minor discrepancies can be anticipated.
This example serves as a compelling validation of the utility of AN-SOF for modeling and designing multi-band ham radio antennas, all within the constraints of real-world conditions, including the presence of an imperfect ground plane. Furthermore, it illustrates that with a relatively modest number of segments, sufficiently accurate results can be achieved, allowing for the replication of measured data.
Tips
- As a general guideline, we advise beginning with a minimum of 10 segments per wavelength of wire, subsequently incrementing this segment count until you achieve convergence or reach an agreeable level of correspondence with experimental data.
- In AN-SOF, the minimum recommended segment count of 10 segments per wavelength is conveniently displayed when creating each wire. However, users also have the flexibility to manually force this minimum recommended segment count by entering “0” (zero) as the number of segments for each wire.
See Also: