How Can We Help?
Search for answers or browse our Knowledge Base.
Guides | Models | Validation | Blog
-
Guides
-
-
- Complete Workflow: Modeling, Feeding, and Tuning a 20m Band Dipole Antenna
- DIY Helix High Gain Directional Antenna: From Simulation to 3D Printing
- Evaluating EMF Compliance - Part 1: A Guide to Far-Field RF Exposure Assessments
- Design Guidelines for Skeleton Slot Antennas: A Simulation-Driven Approach
- Simplified Modeling for Microstrip Antennas on Ungrounded Dielectric Substrates: Accuracy Meets Simplicity
- Fast Modeling of a Monopole Supported by a Broadcast Tower
- Linking Log-Periodic Antenna Elements Using Transmission Lines
- Wave Matching Coefficient: Defining the Practical Near-Far Field Boundary
- AN-SOF Mastery: Adding Elevated Radials Quickly
- Enhancing Antenna Design: Project Merging in AN-SOF
- On the Modeling of Radio Masts
- The Equivalent Circuit of a Balun
- AN-SOF Antenna Simulation Best Practices: Checking and Correcting Model Errors
-
-
- AN-SOF 9: Taking Antenna Design Further with New Feeder and Tuner Calculators
- AN-SOF Antenna Simulation Software - Version 8.90 Release Notes
- AN-SOF 8.70: Enhancing Your Antenna Design Journey
- Introducing AN-SOF 8.50: Enhanced Antenna Design & Simulation Software
- Get Ready for the Next Level of Antenna Design: AN-SOF 8.50 is Coming Soon!
- Explore the Cutting-Edge World of AN-SOF Antenna Simulation Software!
- Upgrade to AN-SOF 8.20 - Unleash Your Potential
- AN-SOF 8: Elevating Antenna Simulation to the Next Level
- New Release: AN-SOF 7.90
- AN-SOF 7.80 is ready!
- New AN-SOF User Guide
- New Release: AN-SOF 7.50
- AN-SOF 7.20 is ready!
- New Release :: AN-SOF 7.10 ::
- AN-SOF 7.0 is Here!
- New Release :: AN-SOF 6.40 ::
- New Release :: AN-SOF 6.20 ::
- Show All Articles2 Collapse Articles
-
-
-
-
Models
-
- Modeling a Super J-Pole: A Look Inside a 5-Element Collinear Antenna
- Simulating the Ingenious Multiband Omnidirectional Dipole Antenna Design
- The Loop on Ground (LoG): A Compact Receiving Antenna with Directional Capabilities
- Precision Simulations with AN-SOF for Magnetic Loop Antennas
- Advantages of AN-SOF for Simulating 433 MHz Spring Helical Antennas for ISM & LoRa Applications
- Radio Mast Above Wire Screen
- Square Loop Antenna
- Receiving Loop Antenna
- Monopole Above Earth Ground
- Top-Loaded Short Monopole
- Half-Wave Dipole
- Folded Dipole
- Dipole Antenna
- The 5-in-1 J-Pole Antenna Solution for Multiband Communications
-
- Extended Double Zepp (EDZ): A Phased Array Solution for Directional Antenna Applications
- Transmission Line Feeding for Antennas: The Four-Square Array
- Log-Periodic Christmas Tree
- Enhancing VHF Performance: The Dual Reflector Moxon Antenna for 145 MHz
- Building a Compact High-Performance UHF Array with AN-SOF: A 4-Element Biquad Design
- Building a Beam: Modeling a 5-Element 2m Band Quad Array
- Broadside Dipole Array
- Log-Periodic Dipole Array
- Broadband Directional Antenna
- A Closer Look at the HF Skeleton Slot Antenna
- The 17m Band 2-Element Delta Loop Beam: A Compact, High-Gain Antenna for DX Enthusiasts
- Enhancing Satellite Links: The Moxon-Yagi Dual Band VHF/UHF Antenna
-
Validation
-
-
- Simple Dual Band Vertical Dipole for the 2m and 70cm Bands
- Linear Antenna Theory: Historical Approximations and Numerical Validation
- Validating Panel RBS Antenna with Dipole Radiators against IEC 62232
- Directivity of V Antennas
- Enhanced Methodology for Monopoles Above Radial Wire Ground Screens
- Dipole Gain and Radiation Resistance
- Convergence of the Dipole Input Impedance
- Impedance of Cylindrical Antennas
-
Print
Plotting Level Curves
Created OnOctober 29, 2022
Updated OnDecember 14, 2023
By:Tony Golden
The Scilab script shown in this video, Isocontours script >, is ready to use together with AN-SOF. It allows us to plot level curves or isocontours of a field pattern. The example shows the electric field pattern at the soil level just below an Inverted-V antenna.
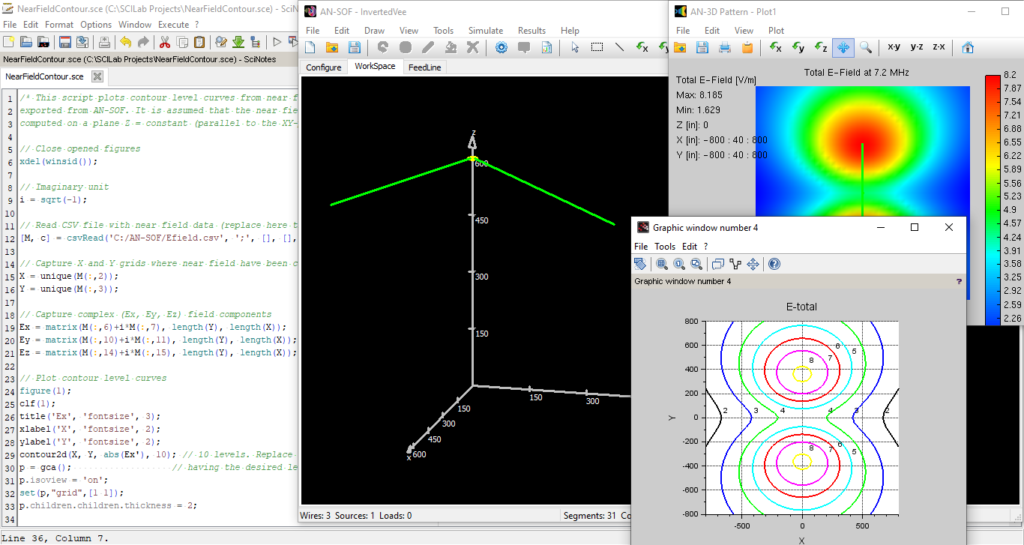
Table of Contents