Search for answers or browse our Knowledge Base.
Guides | Models | Validation | Book
Complete Workflow: Modeling, Feeding, and Tuning a 20m Band Dipole Antenna
Here is a comprehensive guide to modeling, feeding, and tuning half-wave dipoles, offering principles and techniques that can be applied to any antenna system.
Introduction
With the release of AN-SOF version 9, two significant features—Tuner and Feeder—have been introduced. These additions enable comprehensive modeling of an entire antenna feeding system. This includes the power supplied by the transmitter, the impedance matching unit, the feed line, any necessary transformers, and the antenna terminals. In this article, we will model the feeding system for a horizontal half-wave dipole above real ground as an example to demonstrate the extensive options available to users.
Step 1: Modeling a Horizontal Half-Wave Dipole for the 20m Band
We will model a horizontal half-wave dipole for the 20m band, commonly referred to as a Backyard Dipole in the ham radio community. To bring the dipole near resonance, its length will be set to 33.43 feet, representing 0.48 wavelengths (λ) instead of exactly 0.5λ. The dipole will be constructed using #12 wire, which has a radius of 0.0404 inches. It will be positioned 30 feet (0.43λ) above the ground, which has poor conductivity (σ = 0.03 S/m) and a dielectric constant (permittivity) of ε = 20.
The frequency will be varied linearly from 14 to 14.35 MHz in steps of 0.025 MHz (25 kHz). The wire is divided into 11 segments, which is sufficient for the purposes of this example. Since the trial version of AN-SOF is limited to up to 50 segments, this simulation can be performed with the trial version, including the modeling of the tuner and feeder. The dipole is center-fed by a 1 A current source.
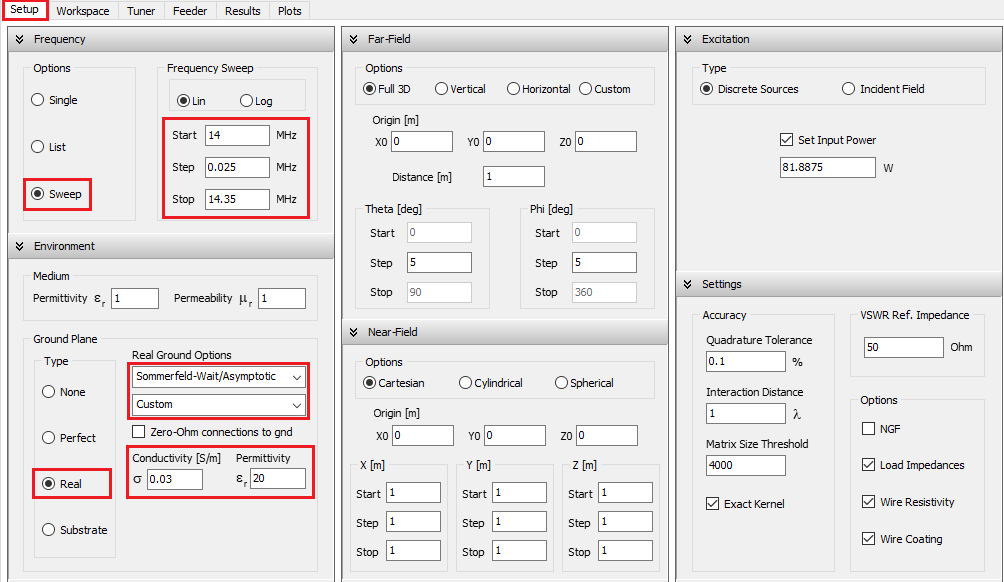
First, set the model parameters in the Setup tab, as shown in Figure 1. Enter the frequency range in the Frequency panel and set the ground plane parameters in the Environment panel. Note that a “Sommerfeld-Wait/Asymptotic” ground plane with custom conductivity and permittivity has been selected. The rest of the parameters in the Setup tab can be left at their default values.
In this example, wire lengths are measured in feet and wire cross-section radii in inches. To change these units, navigate to the AN-SOF main menu > Tools > Preferences and select the desired units in the “Units” tab.
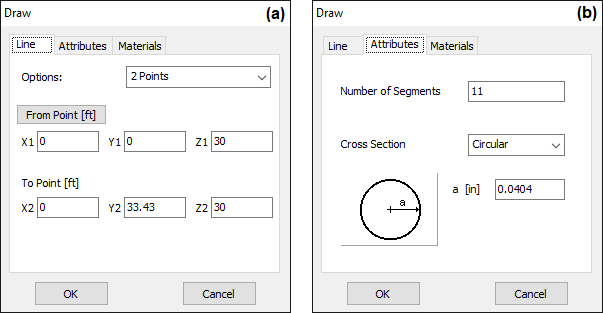
Now, we proceed to the Workspace tab to draw a linear horizontal wire. Right-click on the screen and choose the “Line” command from the pop-up menu. Set the coordinates for the start and end points of the wire, as shown in Figure 2(a). Since we are working with a single wire, we can start the wire at (0,0,Height) and end it at (0,33.43,Height) feet, where 33.43 feet is the wire length. In this example, Height = 30 feet. Next, go to the “Attributes” tab to set the number of segments (11) and the cross-section radius of the wire (0.0404 inches), as illustrated in Figure 2(b). After clicking the OK button, the wire will appear in the Workspace.
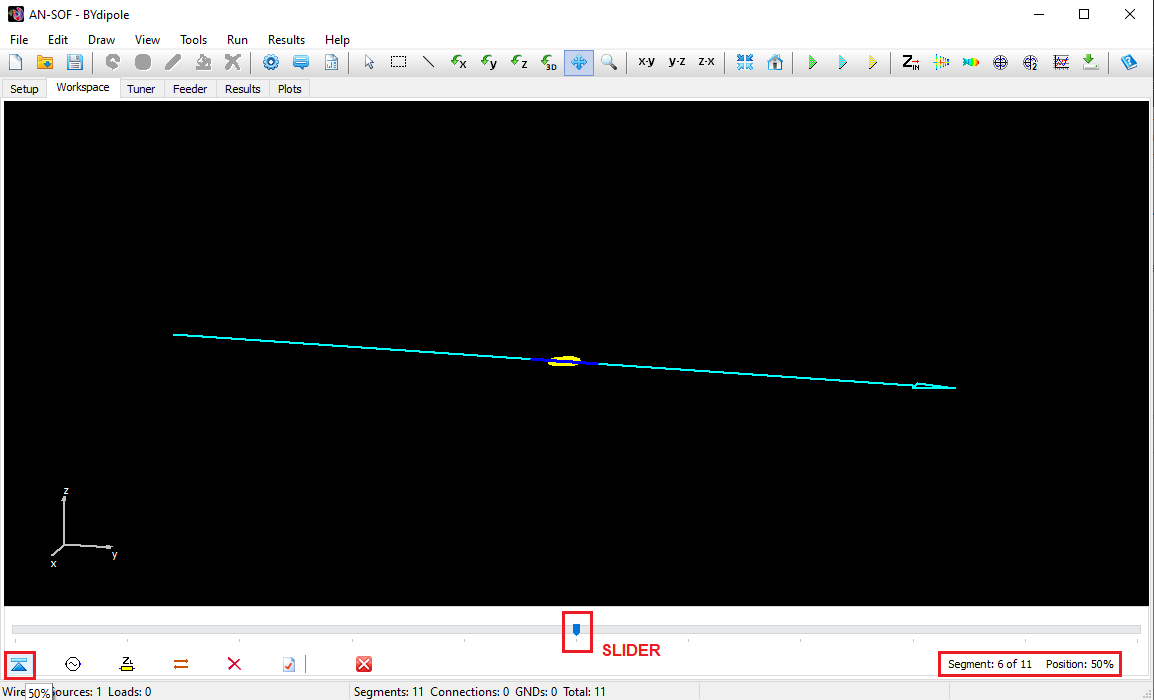
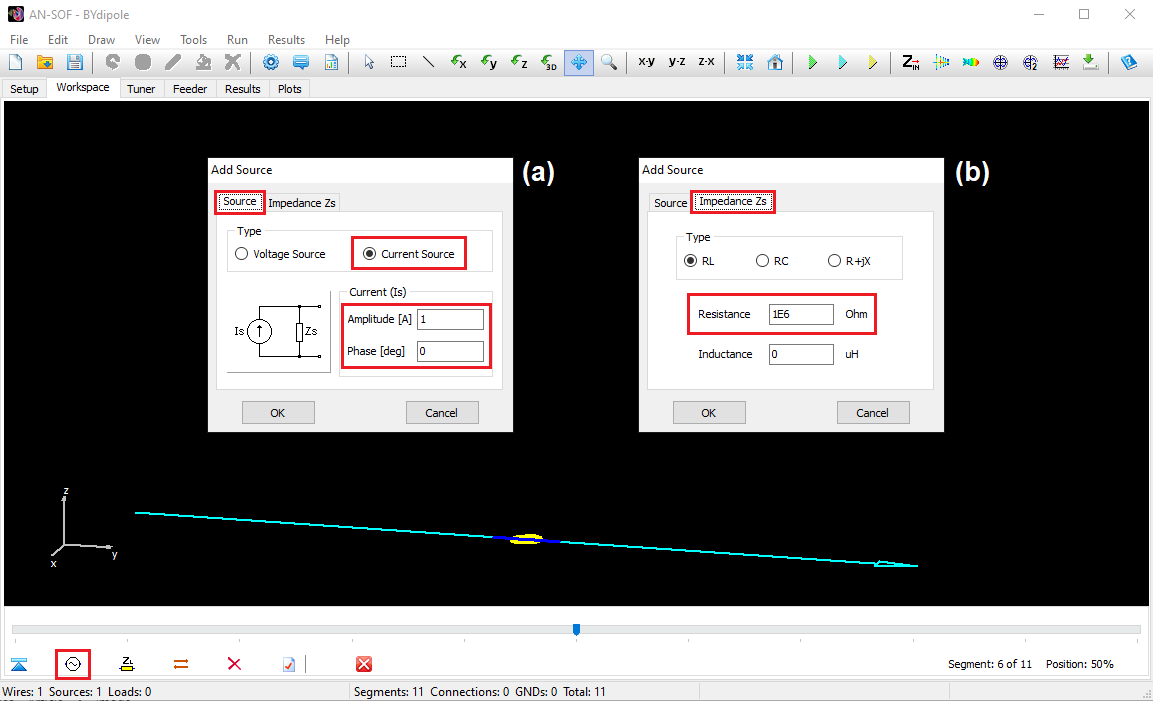
With the horizontal wire drawn, we need to place a current source at the center of the wire. Right-click on the wire and select the Source/Load/TL command. This will display a toolbar at the bottom of the screen with a slider that allows you to select the desired wire segment. Move the slider to the center of the wire or simply click the “50%” button, as shown in Figure 3. Then, click the “Add Source” button and enter a current source of 1 A in amplitude, as shown in Figure 4(a). To model an ideal current source, add a high internal impedance in parallel by going to the “Impedance Zs” tab and entering R = 1E6 Ohms, as shown in Figure 4(b).
With the center-fed dipole set up, we can calculate the antenna input impedance (Zin = Rin + jXin) by pressing Ctrl + R. Next, go to the Plots tab to view the VSWR curve. Ensure that the Antenna option is selected in the “Zin” box at the upper right corner of the screen. The VSWR ranges from approximately 2.5 to 1.8 across the analyzed frequency range, as shown in Figure 5.
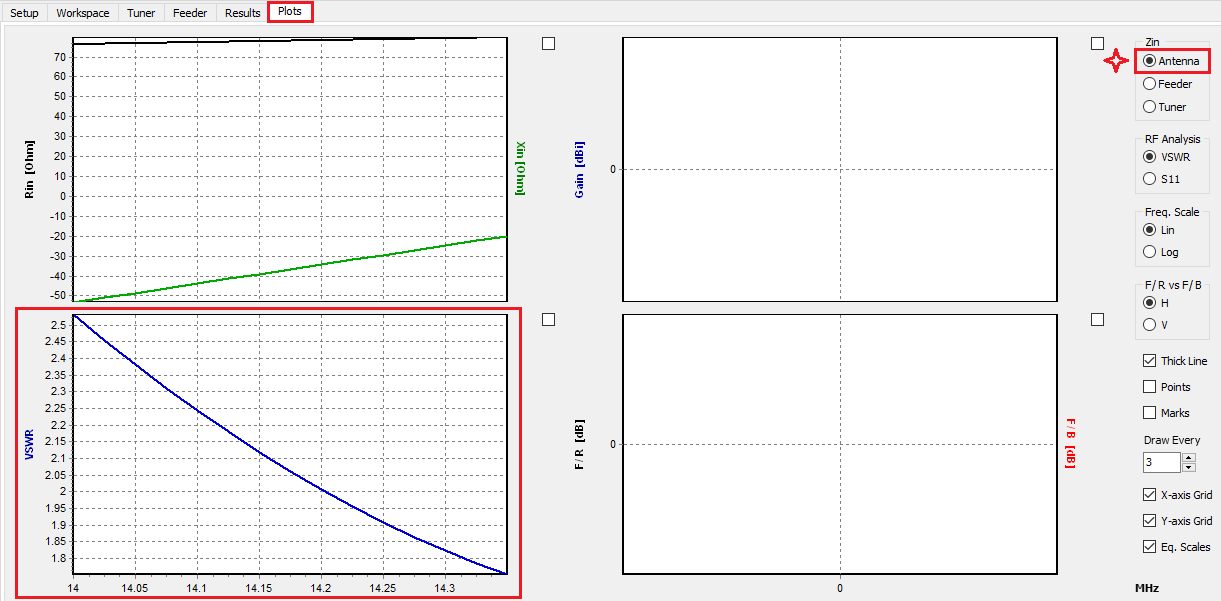
The current source connected to the antenna terminals helps determine the antenna input impedance. Its addition is purely for defining the position of the antenna terminals, from which the input impedance and VSWR are obtained. In the next section, a feeder consisting of a bifilar transmission line will be connected to the antenna terminals.
Step 2: Integrating a Ladder Line Feeder for the Dipole
As commonly used to feed backyard dipoles, we will connect a ladder line to the antenna terminals. Remember, the antenna terminals in the model are defined by the position of the source, so there is no need to modify anything in the antenna model already drawn and calculated in the Workspace tab. Although AN-SOF allows for the explicit addition of a transmission line in the Workspace, for this example, we will model a single feeder using the parameters available in the Feeder tab, so there is no need to add a transmission line in the Workspace.
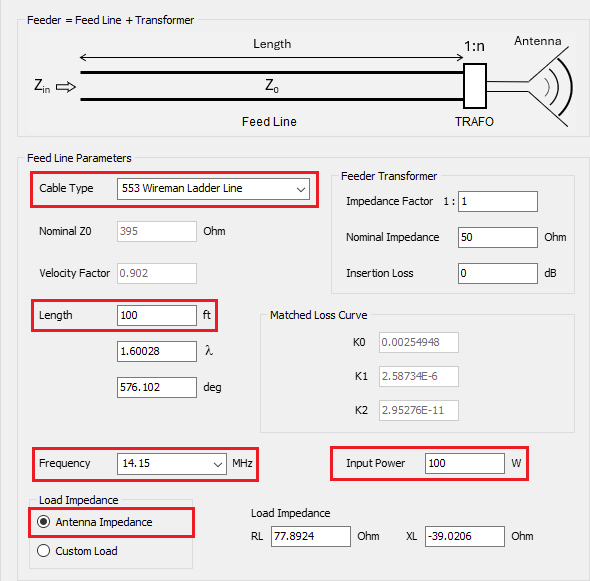
To add the feed line, go to the “Feeder” tab. Under the Cable Type option, select 553 Wireman Ladder Line, which typically has a characteristic impedance of 450 Ohms, though the nominal impedance is lower at 395 Ohms with a velocity factor of 0.902. Enter the line length as 100 feet. The line length in wavelengths and electrical degrees will be displayed automatically. In the Matched Loss Curve box, three parameters, K0, K1, and K2, are shown. These parameters are calculated from the transmission line loss curve provided by the manufacturer. While the computation details are beyond this article’s scope, it’s worth noting that K0 relates to DC losses, K1 to resistive losses (skin effect), and K2 to dielectric losses in the wire insulation.
Next, choose the operating frequency. Here, select the center frequency within your range of interest. The frequencies available here are drawn from the list of frequencies previously set in the Frequency panel of the Setup tab.
Enter the input power to the line. For this step, use 100 W as a reference value, simplifying quick mental calculations, effectively treating it as a percentage. This input power will automatically adjust when the tuner is connected to the feeder in the next step.
Ensure the Antenna Impedance option is selected in the “Load Impedance” box. This option connects the feeder to the antenna terminals, displaying the antenna impedance as a load impedance (RL + jXL) to the feed line at the selected frequency. Alternatively, selecting the “Custom Load” option allows you to enter any desired impedance value, enabling the use of the Feeder calculator as an independent transmission line calculator, separate from the antenna model.
Note that a transformer can be connected between the feed line and the antenna. However, for this example, we will leave this option at its default setting (no transformer added), as we will use a transformer at the tuner’s output in the next section.
The feeder parameters are illustrated in Figure 6, where the design frequency is set to 14.15 MHz.
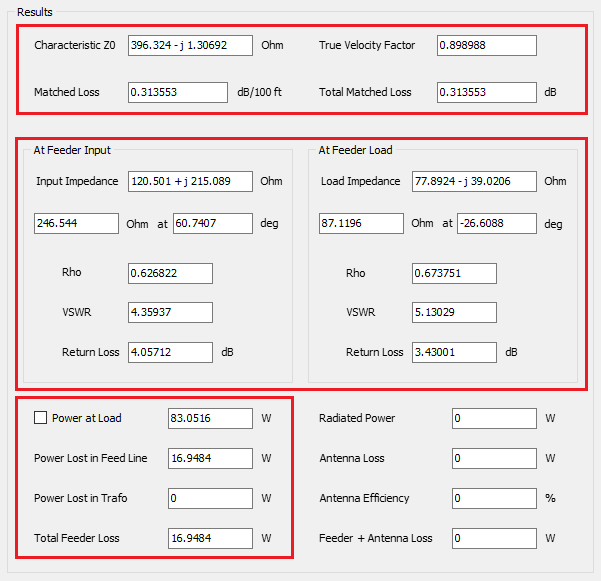
On the right side of the Feeder tab, the calculated results are displayed in the “Results” box. Line losses distort its characteristic impedance, Z0, and velocity factor, generally resulting in an imaginary part in Z0, with the real part differing from the nominal impedance. The Matched Loss, in dB/100 ft, represents the loss in the line per 100 feet when connected to its characteristic impedance. The Total Matched Loss is the matched loss multiplied by the line length.
Next, we examine two sections: At Feeder Input and At Feeder Load. The “At Feeder Input” section displays the input impedance seen at the feed line input terminals. This impedance results from connecting the antenna to the transmission line, thereby transforming the antenna impedance through the line. The feeder input impedance is shown as a complex number (real part + j imaginary part) and as a polar number (magnitude and phase angle).
Additionally, the reflection coefficient (Rho), VSWR, and return loss (dB) at the feeder input are displayed. These values refer to the “true” characteristic impedance of the line, which, as previously noted, differs somewhat from the nominal impedance.
The “At Feeder Load” section shows similar values, but the load impedance of the line (the antenna input impedance) is used to compute Rho, VSWR, and return loss.
At the bottom of the “Results” box, several power metrics in Watts are provided. Power at Load indicates the power delivered to the load impedance of the transmission line (i.e., the antenna impedance). This power is lower than the input power due to losses in the line. Power Lost in Feed Line represents the power dissipated in the line due to its losses (DC, skin effect, and dielectric losses). Power Lost in Trafo indicates the power lost in the transformer between the feed line and the antenna terminals, which will be zero here since no transformer has been added. Total Feeder Loss is the total power lost in the feeder system (feed line + transformer), which equals the power lost in the line since there is no transformer.
At the bottom right of the Results box, there are additional power metrics related to the antenna system, which will all show as zero since we haven’t calculated the radiated power yet. By pressing Ctrl + R (or going to the main menu > Run > Run Currents), we have only calculated the antenna current distribution and the antenna input impedance, not the radiated field. We will calculate the far field after adding the tuner in the next section.
Figure 7 shows the Results box on the right side of the Feeder tab with the described results.
To conclude this section, navigate to the Plots tab and select the Feeder option in the “Zin” box at the upper right corner of the screen. This will display the input impedance and VSWR of the feeder as a function of frequency, indicating the need to tune the antenna, as the VSWR values are still high. Figure 8 illustrates these results.
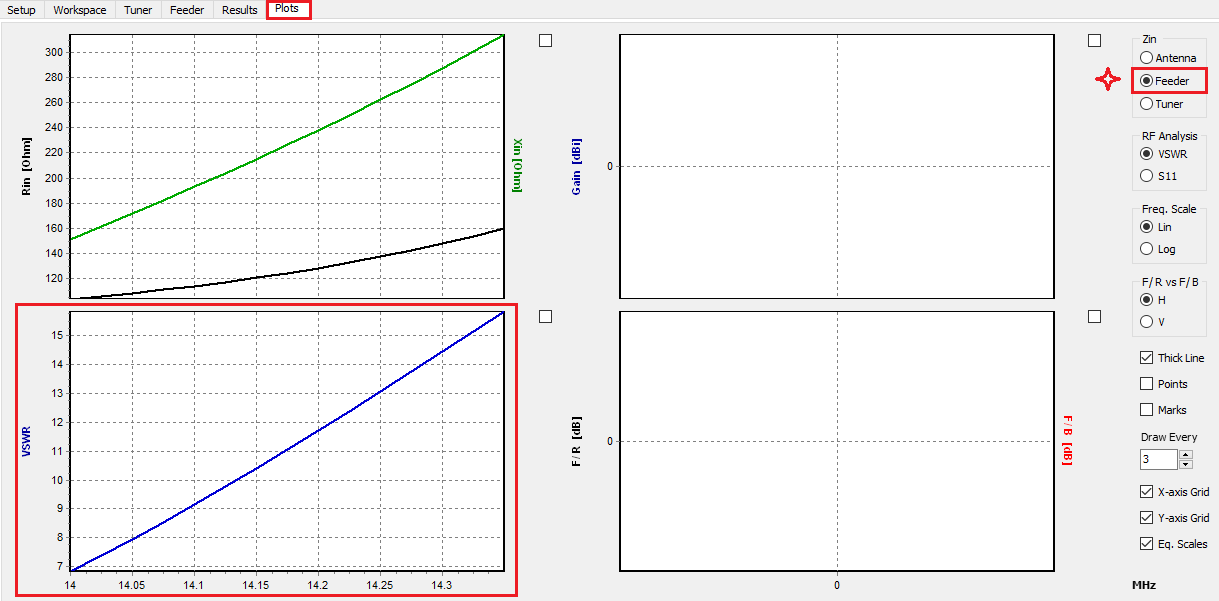
Note that in the “Feeder” tab, a fixed frequency is chosen to calculate the results, including the VSWR relative to the line’s “true” characteristic impedance. In the “Plots” tab, the VSWR is shown as a function of frequency, but instead of being referred to the feed line’s characteristic impedance, it is referred to the reference impedance defined in the Settings panel of the Setup tab, which is 50 Ohms. Therefore, the VSWR at the feeder input shown in the “Feeder” tab at the design frequency will not generally be equal to the VSWR displayed in the “Plots” tab. For practical purposes, we need the VSWR referred to the purely resistive impedance of the transmitter, typically 50 or 75 Ohms. To change this reference impedance, simply adjust it in the Settings panel of the Setup tab.
Step 3: Fine-Tuning the Antenna System with a Transformer and Impedance Matching Network
Given that the input impedance to the “feeder + antenna” system is high, reaching approximately 160 + j 314 Ohms at 14.35 MHz, we will connect a 1:4 balun to the feeder input to reduce the impedance.
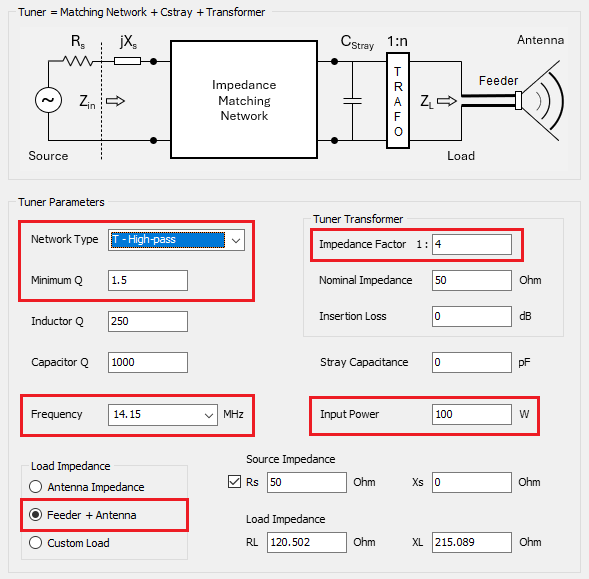
In the Tuner tab, you will find a diagram of the tuner system. First, connect the feeder and antenna system to the tuner. At the bottom left corner of the Tuner window, select Feeder + Antenna as the load for the tuner in the “Load Impedance” box. The tuner system comprises an impedance matching network, stray capacitance, and a transformer. We will first add a 1:4 balun or impedance transformer. In the “Tuner Transformer” box, enter the impedance factor. If modeling transformer losses, set a nominal impedance and an insertion loss, but for this example, we’ll model an ideal transformer with 0 dB insertion loss.
For this 20m band antenna setup, we’ll use a high-pass T network for impedance matching. For PI and T networks, we can set a minimum quality factor (Q), which determines the network’s bandwidth. However, for L networks, Q is determined by the impedances connected at the network input and output ports, making it meaningless to choose Q for L-type networks. A good practice is to choose an L network to see the available Q, then switch to a PI or T network and enter a Q equal to or greater than the available Q for the L network. In this example, we will choose Q = 1.5. The network inductors and capacitors will be automatically calculated and displayed on the upper right side of the Tuner tab, along with their corresponding reactances (±jX) at the chosen design frequency. Adjust the minimum Q value to approximate real-world inductance and capacitance values of standard components.
Inductor Q and capacitor Q can be set separately. We’ll leave the default values, Inductor Q = 250 and Capacitor Q = 1000, as they are commonly encountered in actual network components.
The frequency at which the impedance matching network’s inductors and capacitors are calculated can be set in the Tuner Parameters box, along with the tuner input power. We’ll select 14.15 MHz as the center frequency and an input power of 100 W.
By choosing 14.15 MHz, the load impedance for the tuner will automatically be set to 120.5 + j 215.1 Ohms, which is the input impedance to the feeder + antenna system, not the input impedance at the antenna terminals (check it in the Feeder tab).
The tuner parameters described are illustrated in Figure 9.
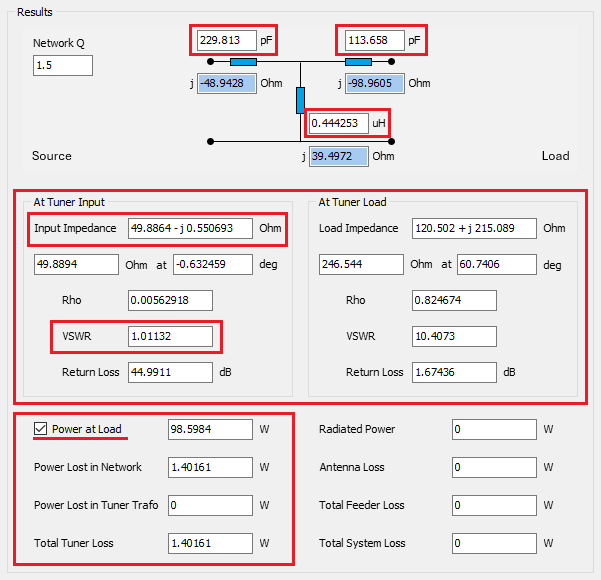
In the Tuner tab’s Results box, a diagram of the high-pass T network is displayed, showing two series capacitors of approximately 230 pF and 114 pF, and a parallel inductor of 0.44 µH. Below this diagram, the input and load impedances of the tuner system are shown, along with the reflection coefficient (Rho), VSWR, and return loss at each side of the tuner. We see that an input impedance of 49.9 – j 0.55 Ohms is achieved, nearly matching the 50 Ohm source impedance. The resulting VSWR at 14.15 MHz is 1.01, indicating an almost perfect match. However, on the load side of the tuner, the VSWR is 10.4, demonstrating the tuner’s impact on the VSWR at each side.
It’s important to note that the input impedance of the Tuner + Feeder + Antenna system is 49.9 – j 0.55 Ohms, not exactly 50 Ohms, due to losses in the tuner components, not numerical errors.
At the bottom of the Results box, various power metrics are shown. Power at Load is the power delivered to the tuner load, which is the “feeder + antenna” system connected to the tuner’s output. By clicking the checkbox next to the “Power at Load” label, you can set this power as the input power to the feeder. This adjustment results in the “feeder + antenna” system being fed by the power from the tuner output port. Verify in the Feeder tab that the input power to the feeder has changed to 98.6 W.
Power Lost in Network shows the power lost in the impedance matching network, which is 1.4 W for the high-pass T network in this example. Since the transformer at the tuner output has 0 dB insertion loss, the Power Lost in Trafo will be zero. Consequently, the Total Tuner Loss, which is the sum of network and transformer losses, equals 1.4 W. Four additional power metrics related to the antenna system remain to be calculated, which will require computing the antenna radiated and lost powers.
Figure 10 illustrates the Results box on the right side of the Tuner tab with the described results.
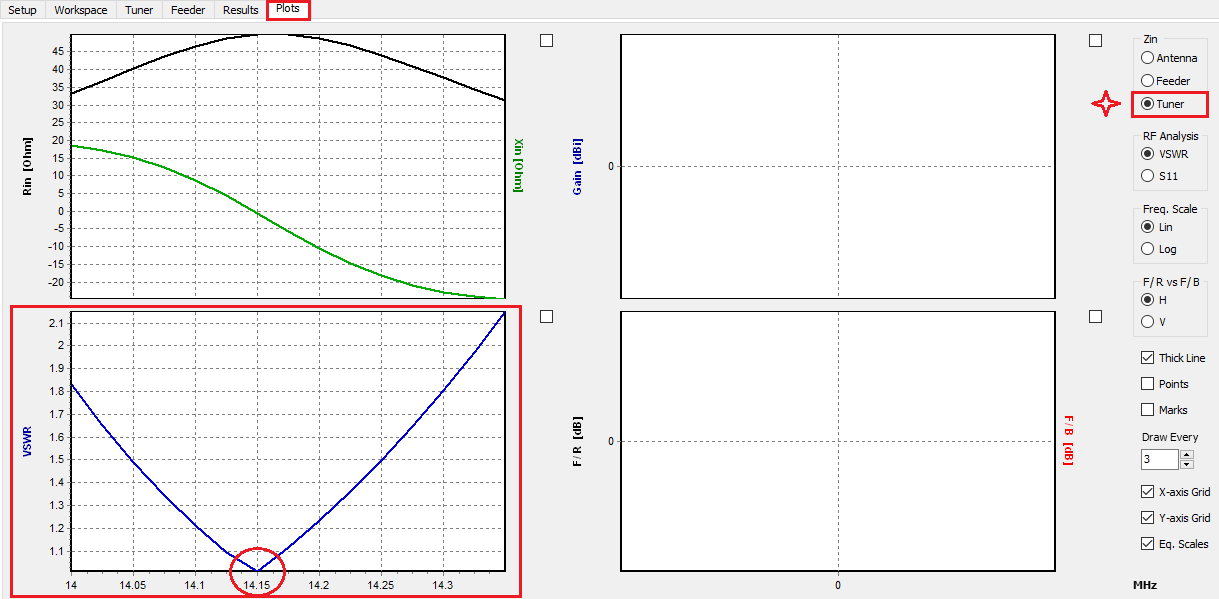
Now, navigate to the Plots tab and select the Tuner option in the “Zin” box at the upper right corner of the window. A V-shaped VSWR plot will appear, centered at the design frequency of 14.15 MHz, where a VSWR of 1.01 is obtained. Figure 11 illustrates these results.
From the perspective of the antenna feeding system, our design is complete. We’ve added a feeder to the antenna terminals, a transformer, and an impedance matching network. The next step is to calculate the far-field radiation pattern to determine the antenna radiated and lost powers. Typically, multiple iterations of the antenna feeding system design process are required. Switch back and forth between the Feeder and Tuner tabs to adjust their parameters until you achieve the desired results. This process is quick since it does not require recalculating the antenna model. If recalculating the antenna input impedance is necessary, press Ctrl + R (or navigate to the main menu > Run > Run Currents) to compute only the antenna current distribution and input impedance. This approach saves time as the far-field calculation is not needed at this step. The next section will focus on the radiated far-field.
Evaluating the Backyard Dipole’s Radiation Performance
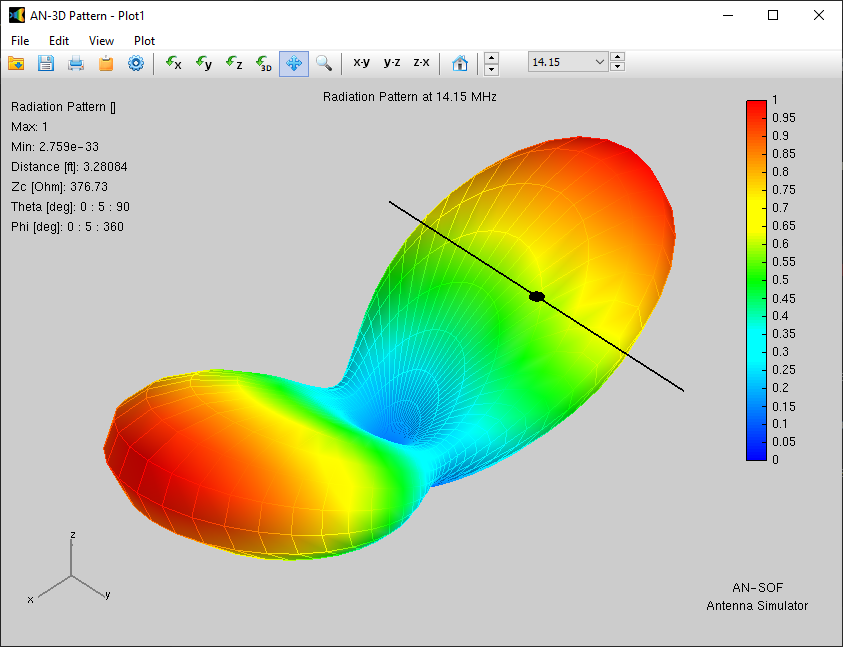
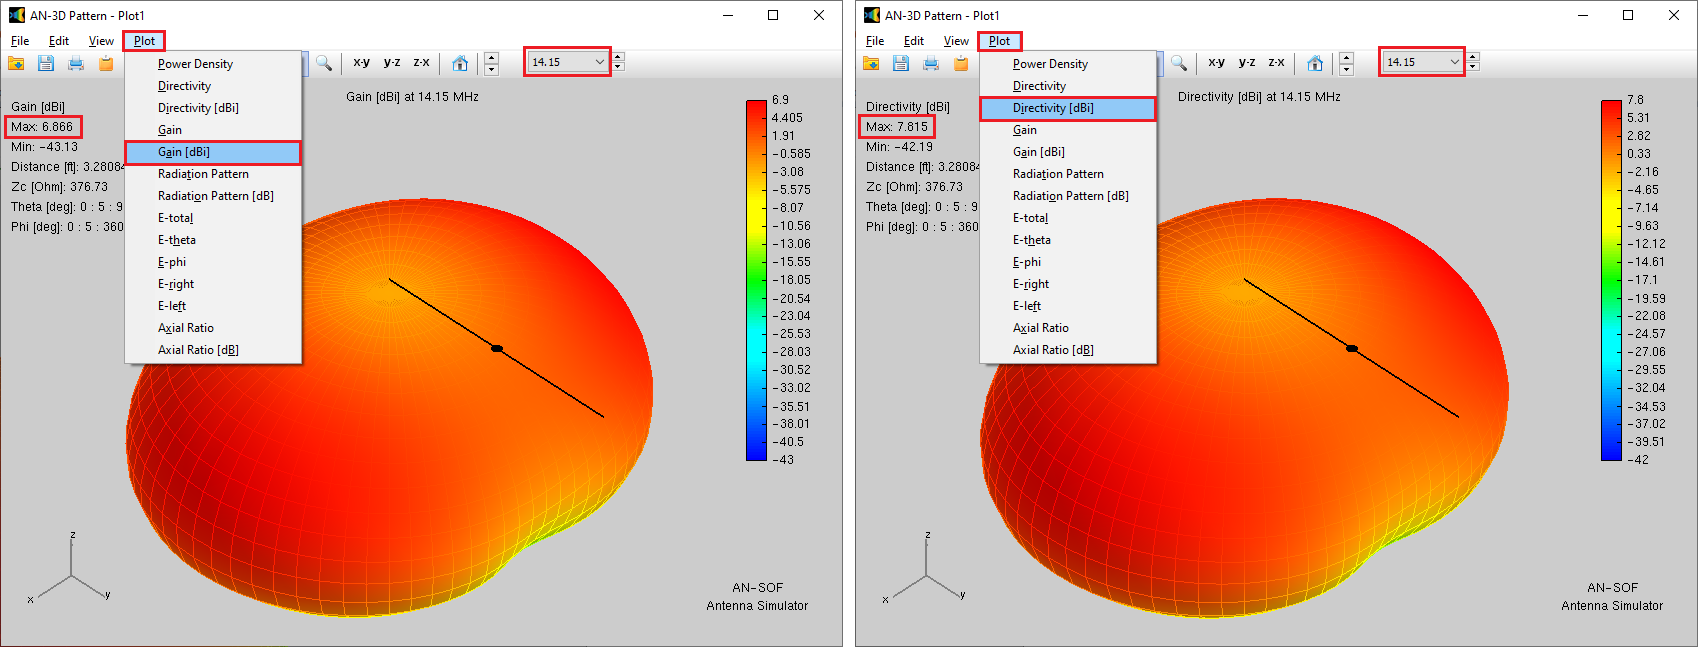
Now that we have completed the design of the backyard dipole feeding system, we are ready to compute its radiation pattern. Press F11 (or navigate to the main menu and select Run > Run Far-Field) to calculate the radiated far-field. Click on the Far-Field 3D Plot button on the main toolbar to display a 3D representation of the radiation pattern. Instead of the typical donut-shaped pattern of a half-wave dipole (with a horizontal axis in this case), two radiation lobes pointing upwards are obtained, as Figure 12 shows. This is an expected result due to reflections of the electromagnetic waves at the air-ground interface.

To plot the antenna gain in dBi, go to the “Plot” menu in the displayed radiation pattern and select the Gain [dBi] option. We can see that a maximum gain of 6.9 dBi is obtained. If we select the Directivity [dBi] option instead, we will see a maximum directivity of 7.8 dBi. This means that the 0.9 dB difference between the directivity and gain is due to power losses in the ground. Figure 13 illustrates these results.
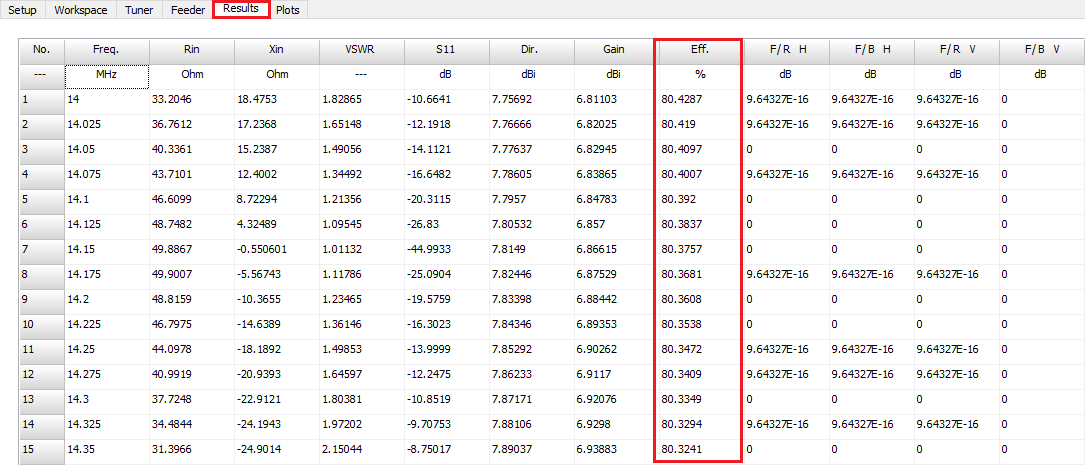
If we return to AN-SOF and access the “Results” tab, we will find a column labeled Eff. that displays the antenna efficiency as a function of frequency (see Fig. 14). Here, we observe a consistent efficiency of 80%, indicating that 20% of the power delivered to the antenna terminals dissipates as heat into the ground below.
If we go to the “Tuner” tab, “Results” box, we will see that the four powers that remained to be calculated now appear with non-null values (see Fig. 15). At the center frequency of 14.15 MHz, the radiated power equals 65.8 W, the antenna loss is 16.1 W, the total feeder loss is 16.7 W, and the total system loss is 34.2 W. The total system loss is the sum of the tuner, feeder, and antenna losses. Since the input power to the tuner has been set to 100 W, this means that 34.2% of this power is lost in the antenna feeding system we have designed.

It is interesting to go to the “Feeder” tab to see the power metrics (see Fig. 16). The feeder input power is 98.6 W, which is the power delivered by the tuner (remember that 1.4 W are lost inside the tuner). The Power at Load is 81.9 W, which is the power delivered to the antenna terminals by the feeder. Therefore, of the 100 W originally injected to the tuner input, we have already lost 100 W – 81.9 W = 18.1 W inside the tuner and feeder together.

The antenna radiated power is 65.8 W and the antenna losses are 16.1 W (just like on the Tuner tab, of course). The antenna efficiency of 80% is also shown. To verify this value, we must take into account that the antenna input power is 81.9 W, so we have Eff = 100 x 65.8 / 81.9 = 80% (rounded to two digits). The sum of the feeder plus antenna losses is shown to be 32.8 W. All these powers correspond to the design frequency of 14.15 MHz.
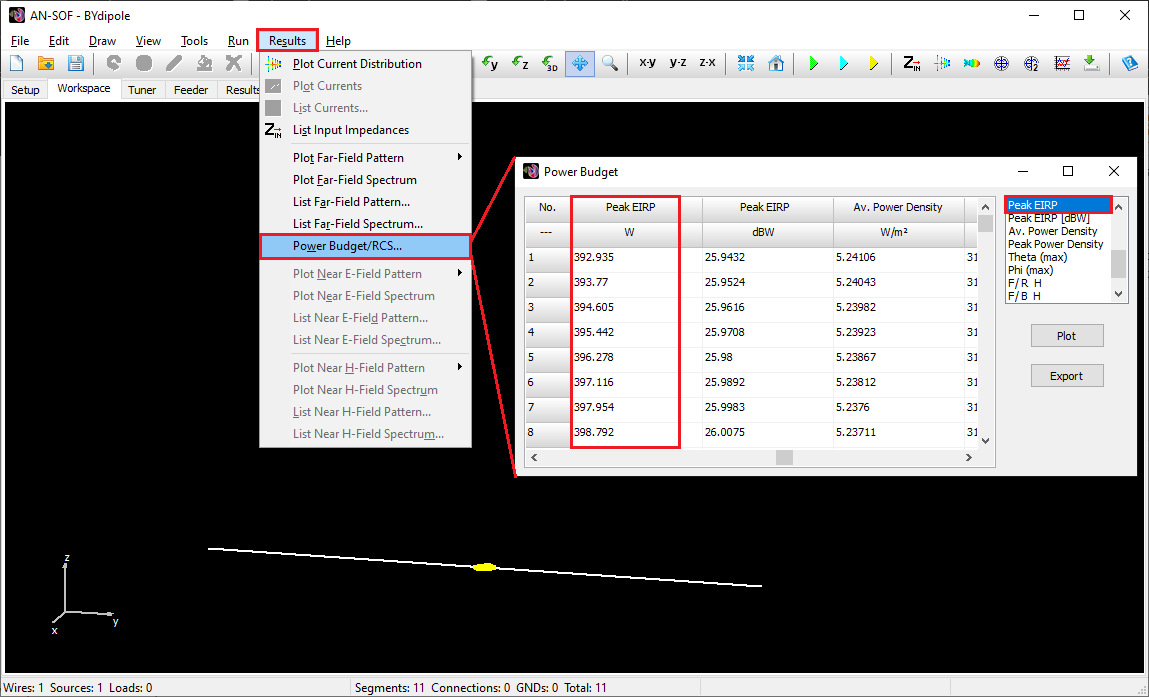
Hover your mouse over the check box next to the “Power at Load” label in the Feeder tab and you will see a hint message that reads “Set as the Antenna Input Power” (see Fig. 16). Click on this check box to set this power, 81.9 W, as the input power delivered to the antenna terminals in the antenna model drawn in the Workspace tab. In this way, all the plots related to the antenna radiated power will be scaled to the actual antenna input power after discounting losses in the feeding system. This is of particular importance when we need to calculate the EIRP (Effective Isotropic Radiated Power) in order to evaluate Electromagnetic Field (EMF) compliance and perform far-field RF exposure assessments. For instance, to plot the EIRP versus frequency after having set 81.9 W as the antenna input power, navigate to the main menu > Results > Power Budget and find the Peak EIRP column in the displayed table (see Fig. 17). We should not be surprised that the peak EIRP takes values close to 400 W, since this figure represents the power that the antenna would radiate if it radiated the maximum radiation intensity isotropically in all directions, and is obtained by multiplying the numerical gain by the antenna input power.
With this section, we have concluded the necessary calculations to obtain the powers involved in the entire radiating system that we have designed.
Conclusions
In this article, we have meticulously walked through the complete workflow of designing, modeling, feeding, and tuning a 20m band backyard dipole antenna. Starting with the Setup and Workspace tabs in AN-SOF, we quickly constructed a horizontal half-wave dipole. We then integrated a ladder line feeder, essential for power delivery to the antenna terminals, and analyzed its effects on the system’s impedance and performance.
Next, we incorporated a tuner system composed of a transformer and an impedance matching network, demonstrating how to tune the antenna system to achieve optimal impedance matching and minimize VSWR.
Finally, we evaluated the radiation performance of the backyard dipole antenna. Through far-field calculations, we visualized the antenna’s radiation pattern and quantified its gain and directivity. This comprehensive analysis highlighted the real-world performance metrics of the antenna, including its efficiency and effective isotropic radiated power (EIRP), which are vital for compliance with electromagnetic field (EMF) regulations and for practical communication purposes.
By following this complete workflow, enthusiasts and professionals alike can design, implement, and optimize antenna systems that meet their specific requirements, whether for amateur radio, professional communication, or educational purposes. The principles outlined in this article serve as a reference for modeling, feeding, and tuning any antenna system.
AN-SOF Feeder and Tuner FAQs
Here are frequently asked questions related to the Feeder and Tuner features:
1. What value should I set for ‘VSWR Ref. Impedance’ in Setup > Settings?
VSWR (Voltage Standing Wave Ratio) measures the standing wave ratio on a transmission line and indicates the impedance match between a load and a reference impedance. For instance, an open-wire line with a characteristic impedance of 450 Ohms will exhibit a VSWR of 1 when terminated with a 450-Ohm load (under ideal conditions). To replicate this in AN-SOF, set the ‘VSWR Ref. Impedance’ to 450 Ohms. However, the VSWR is commonly measured at the transmitter end of a feeding system, typically using 50 or 75 Ohms as reference impedances. AN-SOF’s flexibility in setting the VSWR reference impedance allows users to analyze VSWR at various points in the antenna feeding system relative to the desired reference value.
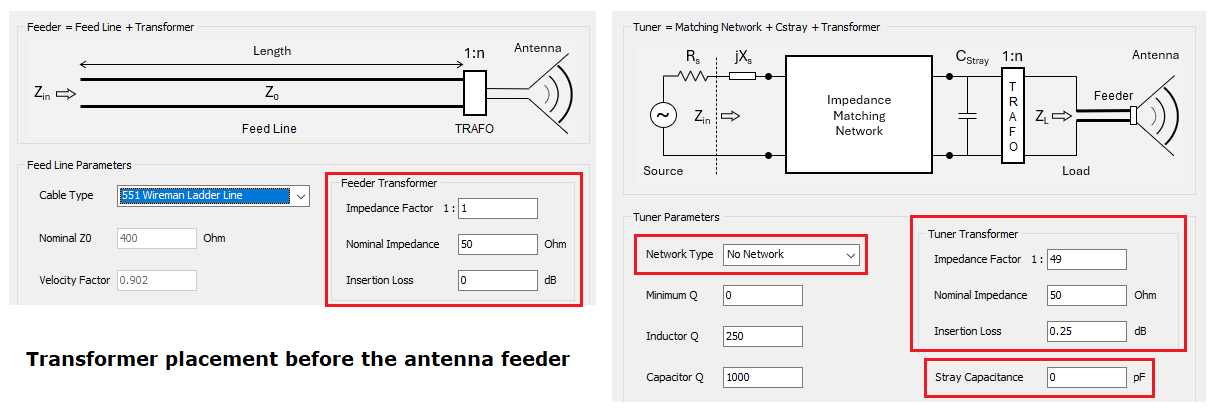
2. On the Feeder tab, the feeder diagram shows the transformer (TRAFO) positioned between the feedline and the antenna, resulting in the sequence: feedline + transformer + antenna. How can I add a transformer before the feedline, so that the sequence becomes: transformer + feedline + antenna?
If a transformer between the feedline and antenna is unnecessary, configure a 1:1 transformer with 0 dB insertion loss. To introduce a transformer at the feeder input, access the ‘Tuner’ tab and define the desired transformer parameters (see Fig. 18). If no additional impedance matching network is required, select the ‘No Network’ option and set the ‘Stray Capacitance’ to 0. This configuration effectively places the transformer at the feeder input without introducing other components.
3. What should I enter for the nominal impedance of a transformer?
The nominal impedance is only relevant when a transformer exhibits insertion loss. For ideal transformers (0 dB insertion loss), the default value of 50 Ohms can be retained. The nominal impedance is typically specified in transformer datasheets. For example, an unun with a 1:49 ratio, designed to reduce a high impedance to 50 Ohms, would have a nominal impedance of 50 Ohms.
Insertion loss quantifies the power reduction within a transformer relative to the input power. It is expressed in decibels (dB). Consequently, the output power delivered to the load is lower than the input power due to energy dissipation within the transformer’s materials (conductor and core losses).

