
How Can We Help?
Search for answers or browse our Knowledge Base.
Guides | Models | Validation | Book
-
Guides
-
-
- How to Select the Right Ground Plane Model
- New Tools in AN-SOF: Selecting and Editing Wires in Bulk
- How to Speed Up Simulations in AN-SOF: Tips for Faster Results
- Enhancing Antenna Design Flexibility: Project Merging in AN-SOF
- AN-SOF Antenna Simulation Best Practices: Checking and Correcting Model Errors
- How to Adjust the Radiation Pattern Reference Point for Better Visualization
-
- Modeling Lumped Loads in AN-SOF: Canceling Feedpoint Reactance for a Perfect Match
- Can AI Design Antennas? Lessons from a 3-Iteration Yagi-Uda Experiment
- Modeling Common-Mode Currents in Coaxial Cables: A Hybrid Approach
- Beyond Analytical Formulas: Accurate Coil Inductance Calculation with AN-SOF
- Complete Workflow: Modeling, Feeding, and Tuning a 20m Band Dipole Antenna
- DIY Helix High Gain Directional Antenna: From Simulation to 3D Printing
- Design Guidelines for Skeleton Slot Antennas: A Simulation-Driven Approach
- Linking Log-Periodic Antenna Elements Using Transmission Lines
- AN-SOF Mastery: Adding Elevated Radials Quickly
- Fast Modeling of a Monopole Supported by a Broadcast Tower
- RF Techniques: Implicit Modeling and Equivalent Circuits for Baluns
-
- Antenna Far-Field Comparison using Multi-Slice and Multi-Frequency Plots
- Understanding the Antenna Near Field: Key Concepts Every Ham Radio Operator Should Know
- Evaluating EMF Compliance - Part 1: A Guide to Far-Field RF Exposure Assessments
- Evaluating EMF Compliance - Part 2: Using Near-Field Calculations to Determine Exclusion Zones
- Wave Matching Coefficient: Defining the Practical Near-Far Field Boundary
- AN-SOF Data Export: A Guide to Streamlining Your Workflow
- Front-to-Rear and Front-to-Back Ratios: Applying Key Antenna Directivity Metrics
- Exporting Radiation Patterns to MSI Planet Format: A Step-by-Step Guide
- Exporting Radiation Patterns to Radio Mobile: A Step-by-Step Guide
- Generating Field Isocontours: Integrating AN-SOF with Scilab
-
-
-
- Introducing AN-SOF 11: Precision Modeling and Next-Gen Electromagnetic Simulation
- Introducing AN-SOF 10.5 – Smarter Tools, Faster Workflow, Greater Precision
- Introducing the AN-SOF Engine: Power, Speed, and Flexibility for Antenna Simulation
- What’s New in AN-SOF 10? Smarter Tools for RF Professionals and Antenna Enthusiasts
- To Our Valued AN-SOF Customers and Users: Reflections, Milestones, and Future Plans
- AN-SOF 9.50 Release: Streamlining Polarization, Geometry, and EMF Calculations
- AN-SOF 9: Taking Antenna Design Further with New Feeder and Tuner Calculators
- AN-SOF Antenna Simulation Software - Version 8.90 Release Notes
- AN-SOF 8.70: Enhancing Your Antenna Design Journey
- Introducing AN-SOF 8.50: Enhanced Antenna Design & Simulation Software
- Get Ready for the Next Level of Antenna Design: AN-SOF 8.50 is Coming Soon!
- Upgrade to AN-SOF 8.20 - Unleash Your Potential
- AN-SOF 8: Elevating Antenna Simulation to the Next Level
- Evolution of AN-SOF: New Features and Enhancements from Version 6.20 to 7.90
-
-
- Types of Wires
- Wire Attributes
- Wire Materials
- Enabling/Disabling Resistivity
- Enabling/Disabling Coating
- Cross-Section Equivalent Radius
- Exporting Wires
-
-
Models
-
- Download Example Models
- Explore 5 Antenna Models with Less Than 50 Segments in AN-SOF Trial Version
- Modeling a Center-Fed Cylindrical Antenna with AN-SOF
- Modeling a Circular Loop Antenna in AN-SOF: A Step-by-Step Guide
- Monopole Antennas Over Imperfect Ground: Modeling and Analysis with AN-SOF
- Modeling Helix Antennas in Axial Radiation Mode Using AN-SOF
- Step-by-Step: Modeling Basic Yagi-Uda Arrays for Beginners
-
- Modeling an Inverted V Antenna for 40 Meters: Design Insights and Ground Effects
- Modeling a Super J-Pole: A Look Inside a 5-Element Collinear Antenna
- The 5-in-1 J-Pole Antenna Solution for Multiband Communications
- Simulating a Multiband Omnidirectional Dipole Antenna Design
- Understanding the Folded Dipole: Structure, Impedance, and Simulation
- An Efficient Approach to Simulating Radiating Towers for Broadcasting Applications
- Design and Simulation of Short Top-Loaded Monopole Antennas for LF and MF Bands
-
- The Loop on Ground (LoG) Antenna: A Compact Solution for Directional Reception
- Precision Simulations with AN-SOF for Magnetic Loop Antennas
- Experimenting with Half-Wave Square Loops: Simulation and Practical Insights
- Radar Cross Section and Reception Characteristics of a Passive Loop Antenna: A Simulation Study
-
- Simulating Helical Antennas over Finite Wire-Grid Ground Planes
- Introduction to Yagi-Uda Arrays: Analyzing a 5-Element Beam with a Folded Dipole Driver
- Explicit Modeling of a 9-Element LPDA: Capturing Real-World Wideband Performance
- Exploring an HF Log-Periodic Sawtooth Array: Insights from Geometry to Simulation
- Boosting Performance with Dual V Antennas: A Practical Design and Simulation
-
- The Lazy-H Antenna: A 10-Meter Band Design Guide
- Extended Double Zepp (EDZ): A Phased Array Solution for Directional Antenna Applications
- Transmission Line Feeding in Antenna Design: Exploring the Four-Square Array
- Enhancing VHF Performance: The Dual Reflector Moxon Antenna for 145 MHz
- Building a Compact High-Performance UHF Array with AN-SOF: A 4-Element Biquad Design
- Building a Beam: Modeling a 5-Element 2m Band Quad Array
- A Closer Look at the HF Skeleton Slot Antenna
- The 17m Band 2-Element Delta Loop Beam: A Compact, High-Gain Antenna for DX Enthusiasts
- The Moxon-Yagi Dual-Band VHF/UHF Antenna for Superior Satellite Link Performance
-
- Rectangular Microstrip Patch Antennas: A Comparative Analysis of Transmission Line Theory and AN-SOF Numerical Results
- High-Performance Impedance Matching in Microstrip Antennas: The Role of Capacitive Feeding
- Simplified Modeling of Microstrip Antennas on Ungrounded Dielectric Substrates: A Practical First-Order Approach
- A Simple, Low-Cost Approach to Simulating Solid Wheel Antennas at 2.4 GHz
-
- Nelder-Mead Optimization for Antenna Design Using the AN-SOF Engine and Scilab
- Evolving Better Antennas: A Genetic Algorithm Optimizer Using AN-SOF and Scilab
- Building Effective Cost Functions for Antenna Optimization: Weighting, Normalization, and Trade-offs
- Element Spacing Simulation Script for Yagi-Uda Antennas
- Automating 2-Element Quad Array Design: Scripting and Bulk Processing in AN-SOF
-
-
Validation
-
- The AN-SOF Calculation Engine
- Electric Field Integral Equation
- The Exact Kernel
- The Method of Moments
- Excitation of the Structure
- Curved vs. Straight Segments
-
- Navigating the Numerical Landscape: Choosing the Right Antenna Simulation Method
- The 7 Limitations of Traditional MoM — and Why Measurement-Grade Conformal MoM Exists
- Beyond NEC: Accurate LF/MF Grounding with the James R. Wait Model
- Validating Numerical Methods: Transmission Line Theory and AN-SOF Modeling
- Circuit Theory Validation: Simulating an RLC Series Resonator
-
- Validation of a Panel RBS Antenna with Dipole Radiators against IEC 62232 Standard
- Linear Antenna Theory: Historical Approximations and Numerical Validation
- Simple Dual Band Vertical Dipole for the 2m and 70cm Bands
- Validating V Antennas: Directivity Analysis with AN-SOF
- Validating Dipole Antenna Simulations: A Comparative Study with King-Middleton
- Energy Conservation and Gain Convergence in Cylindrical Dipoles: A Numerical Validation Study
- Numerical Convergence and Stability of Input Impedance in Cylindrical Dipoles
- Advanced Modeling of Monopoles over Radial Wire Ground Screens
-
- Precision Modeling of Small Loop Antennas: Validating the Conformal Method of Moments (CMoM)
- Input Impedance and Directivity of Large Circular Loops: Theory vs. Numerical Simulation
- Helical Antennas in Normal Mode: Theoretical Limits and Numerical Validation
- Validating AN-SOF Simulations for Gain and VSWR of Helix Antennas in Axial Mode
-
-
Book
-
- 1.0 Preface & Table of Contents
- 1.1 Maxwell’s Equations and Electromagnetic Radiation
- 1.2 The Isotropic Radiator
- 1.3 Arrays of Point Sources
- 1.4 The Hertzian Dipole – FREE SAMPLE
- 1.5 The Short Dipole
- 1.6 The Half-Wave Dipole
- 1.7 Thin Dipoles of Arbitrary Length
- 1.8 Ground Plane and Image Theory
- 1.9 Monopole Antennas
- Lab 1: Radiation & Ideal Physics
-
- 2.1 Radiation Pattern Fundamentals
- 2.2 Polarization
- 2.3 Radiated Power and Energy Conservation
- 2.4 Radiation Resistance
- 2.5 Radiation Efficiency
- 2.6 Directivity and Gain
- 2.7 Beamwidth and Sidelobes
- 2.8 Feedpoint Impedance and Bandwidth
- 2.9 The Reciprocity Principle
- 2.10 Receiving Mode Operation
- 2.11 Effective Aperture and Gain
- 2.12 The Friis Transmission Equation
- Lab 2: Performance & Metrics
-
To analyze the impedance matching and power efficiency of your antenna across the simulated frequency range, use the following procedure:
- Select the Source Wire: Right-click on the wire containing the source to open the pop-up menu.
- Activate the Toolbar: Click the Current vs. Freq… command to bring up the Current vs. Freq. toolbar (Fig. 1).
- Target the Source Segment: Use the slider to select the specific segment where the source is located. If you positioned the source at the exact center, the 50% button will jump there instantly.
- Access the Input List: Click the Input List button. This opens the Input List dialog box containing:
- Input Impedance: Real and imaginary parts.
- Source Data: Input current, voltage, and power.
- Matching Parameters: Reflection coefficient, VSWR, and S11 (Return Loss) in decibels.
- Visualize the Data:
- XY Plot: Select a parameter (like VSWR or S11) from the list in the upper right corner and press Plot to see its frequency response.
- Smith Chart: Press the Smith button to visualize how the input impedance moves across the complex plane relative to the characteristic impedance.
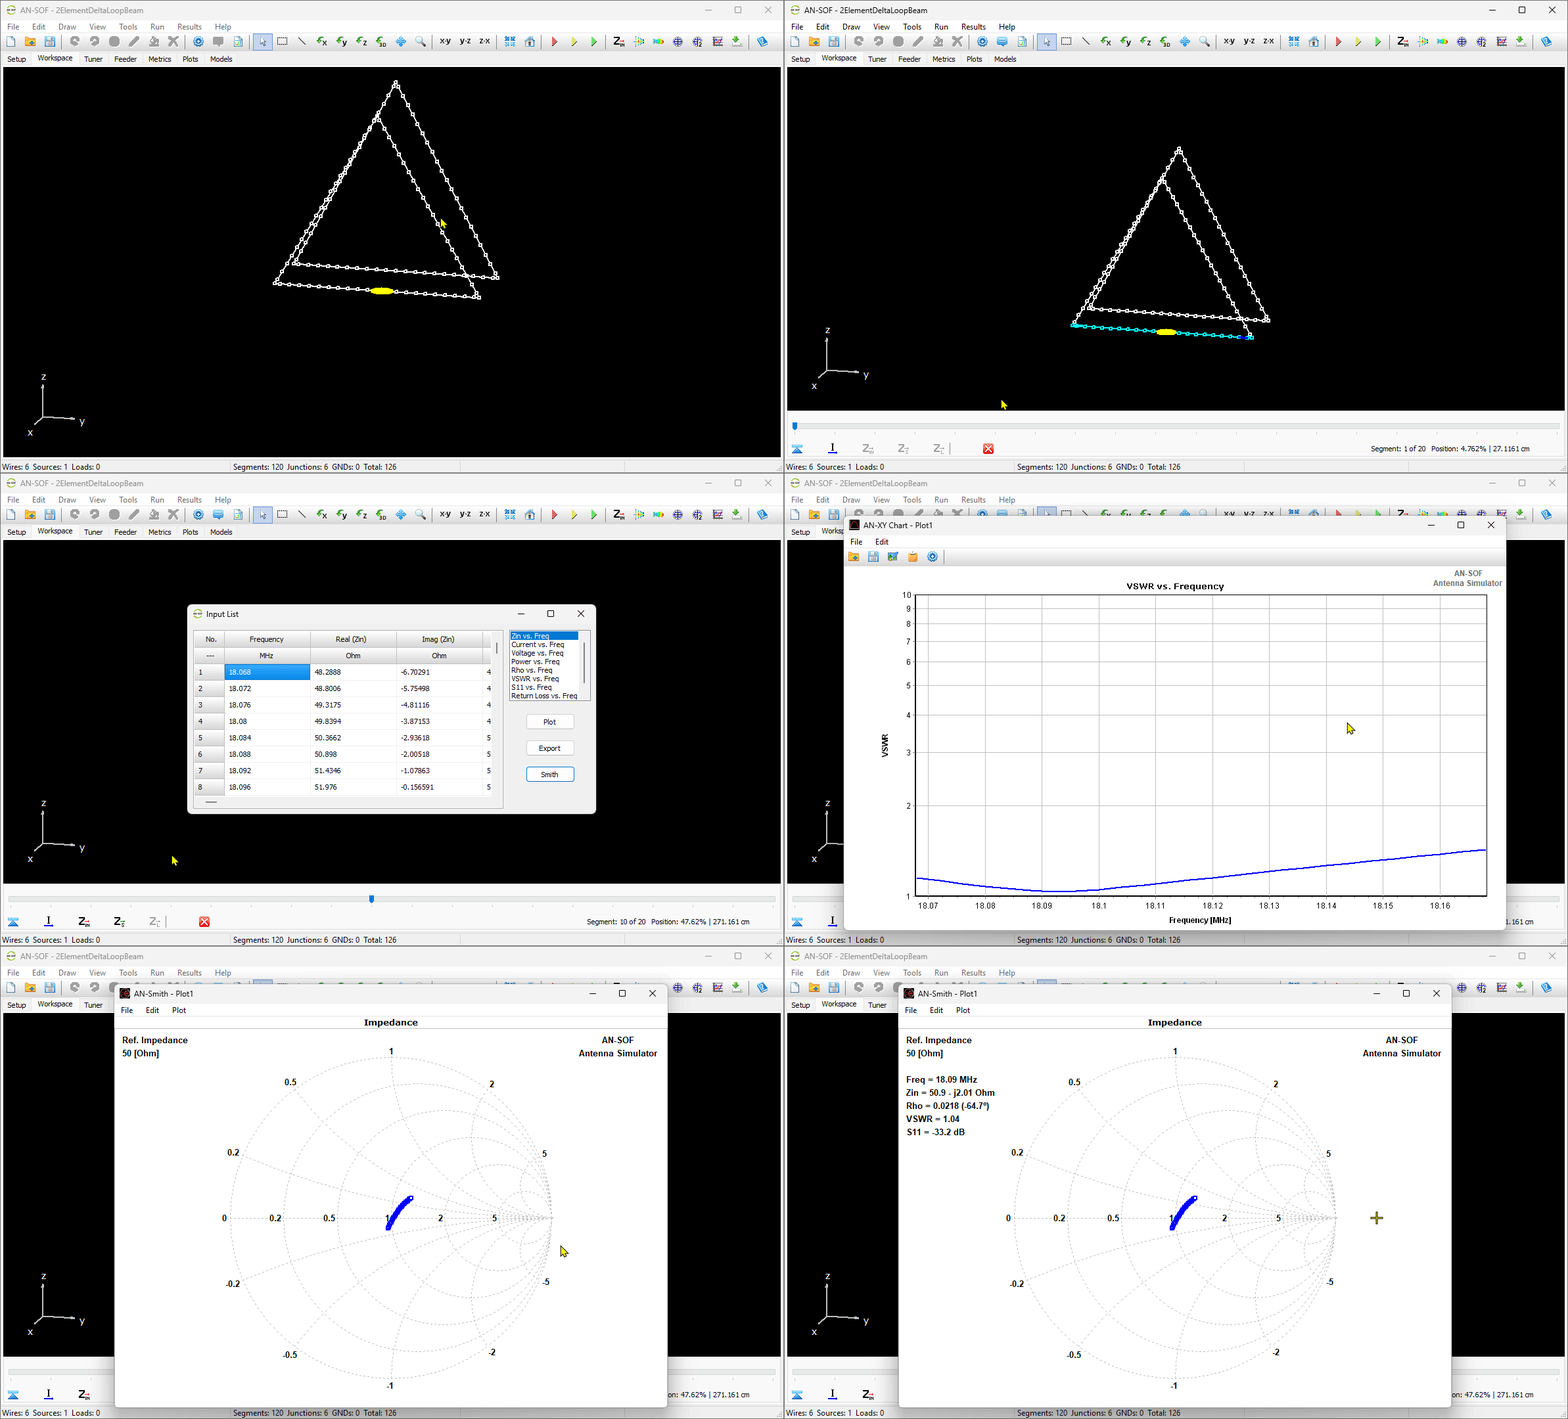
To ensure your reflection data (VSWR, S11, and Return Loss) aligns with your specific system, you can customize the reference impedance and use shortcuts to access source data.
Setting the Reference Impedance
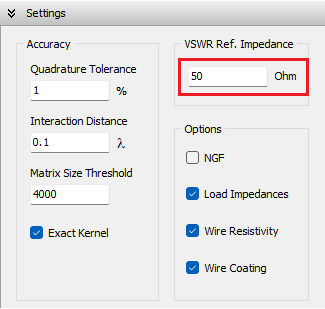
By default, calculations are referenced to $50\ \Omega$, but you can adjust this value to match your specific feedline or connector:
- Navigate to the Setup tab in the main workspace.
- Locate the Settings panel (Fig. 2).
- Enter your desired value in the VSWR Ref. Impedance field.
Quick Access to Source Data
If your antenna has multiple sources, you can bypass the segment selection slider and access the input data directly (Fig. 3):
- Go to the Metrics tab and select the source index from the drop-down menu. Source indexes are displayed next to each source in the workspace when the model contains two or more sources.
- Go to the main menu and select Results > Input Impedance Table (or click the Input Impedance Table button, ZIN, on the toolbar).
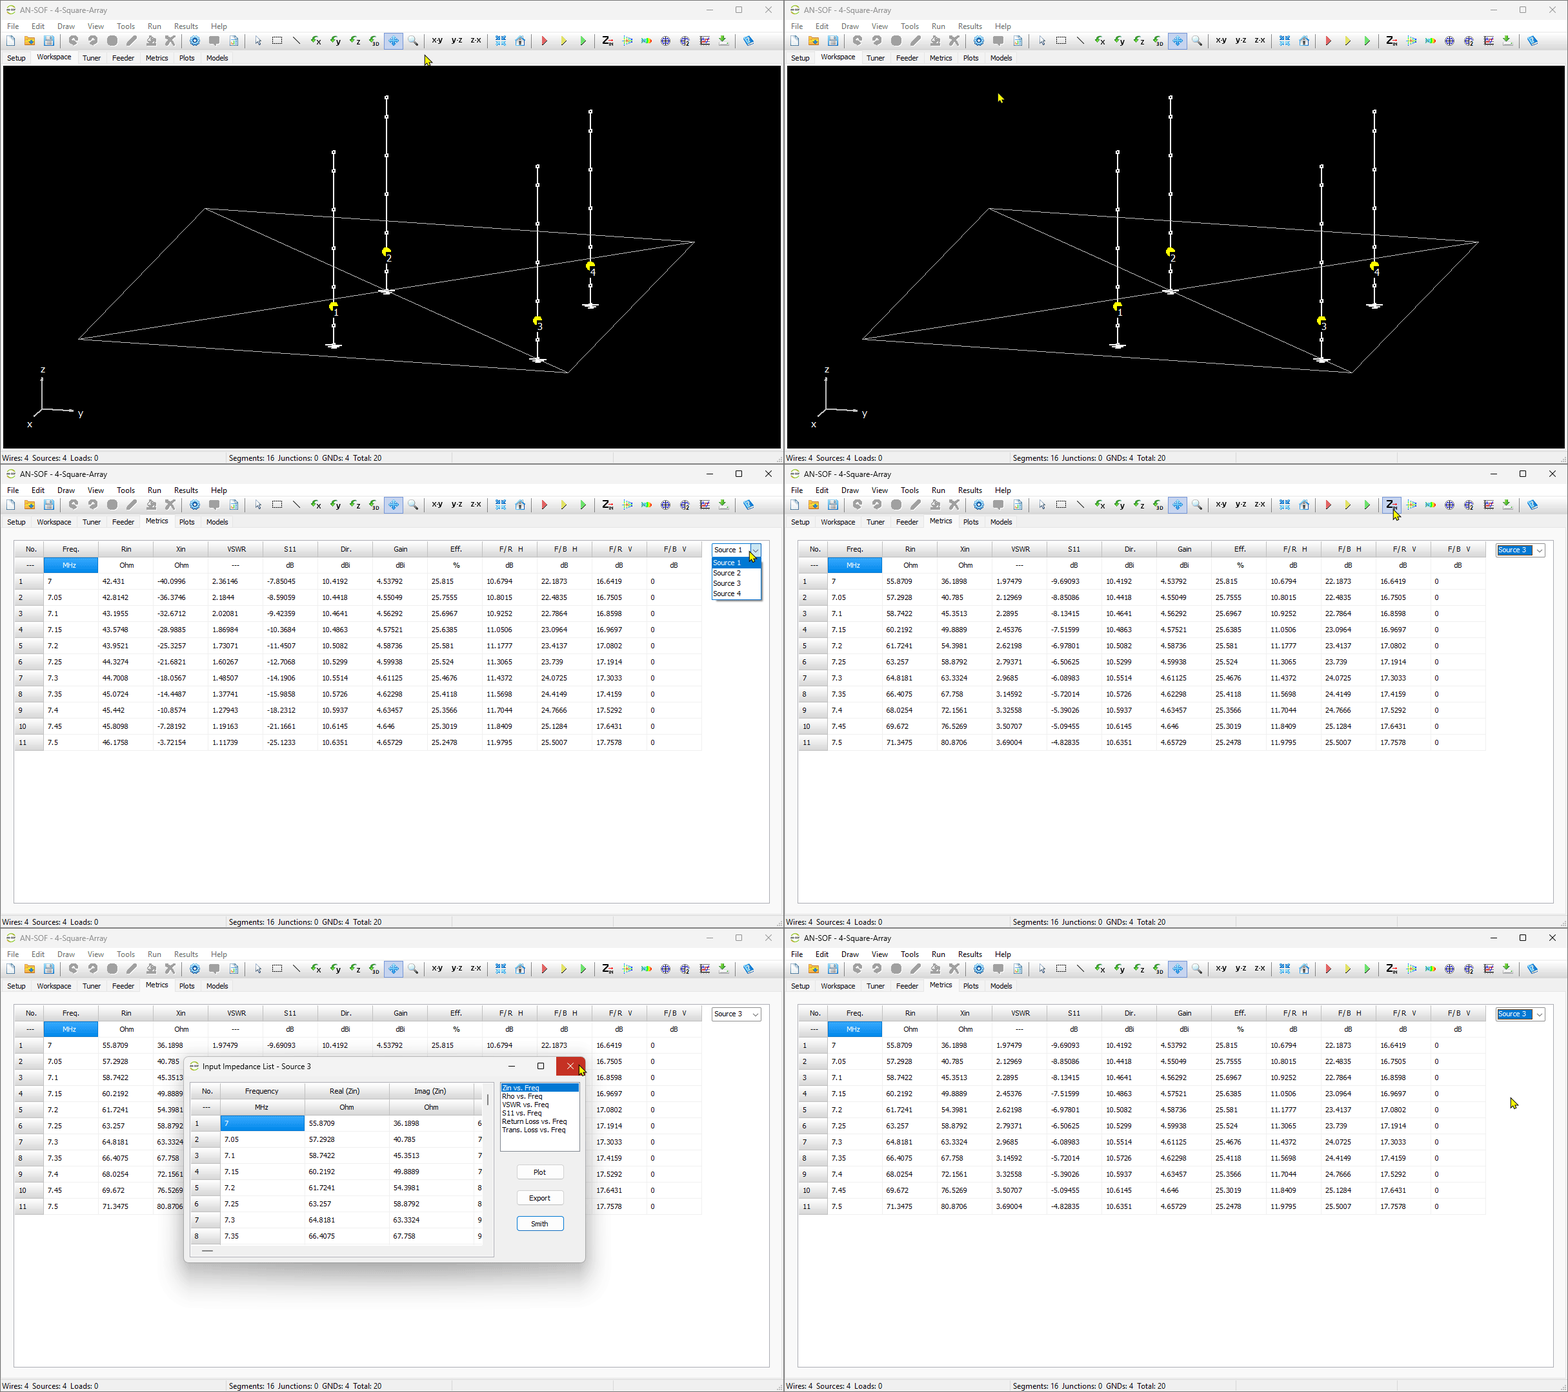
Table of Contents