Search for answers or browse our Knowledge Base.
Guides | Models | Validation | Book
Explicit Modeling of a 9-Element LPDA: Capturing Real-World Wideband Performance
Explore the precision of explicit boom modeling in this 9-element LPDA study. Using AN-SOF, we analyze a 200-800 MHz log-periodic array, demonstrating how the ‘active region’ shifts with frequency to maintain stable gain and VSWR. Learn why modeling feed lines as physical wires provides a superior analysis of wideband antenna performance.

The Principles of Frequency-Independent Design
The Log-Periodic Dipole Array (LPDA) belongs to a class of “frequency-independent” antennas. The fundamental requirement for such an antenna is that its electrical properties remain invariant when its physical dimensions are scaled. While a truly frequency-independent antenna would need to be infinite in size, the LPDA approximates this behavior by employing a self-similar, truncated geometry.
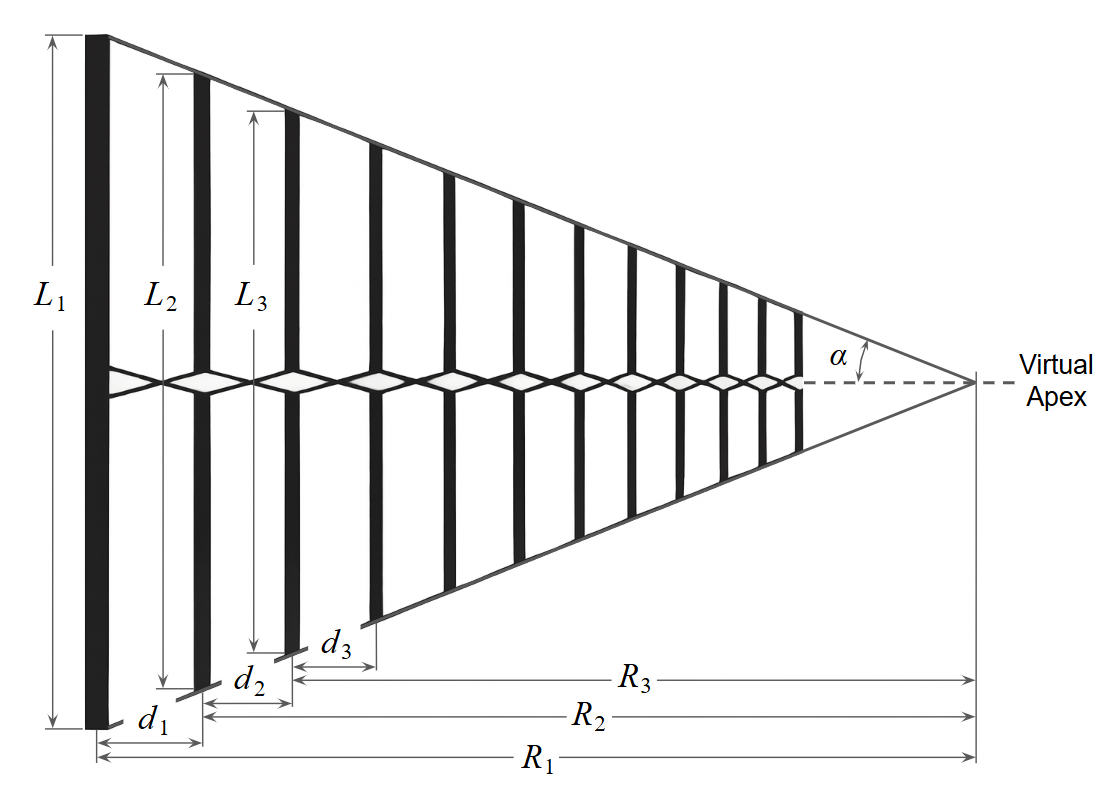
The design is governed by two primary dimensionless parameters (Fig. 1):
1. The Scaling Factor ($\tau$): Defines the ratio of lengths ($L$) and distances from the apex ($R$) of adjacent elements:
$\displaystyle \tau \,=\, \frac{L_{n+1}}{L_n} \,=\, \frac{R_{n+1}}{R_n} < 1$
2. The Spacing Factor ($\sigma$): Relates the element spacing to the length of the adjacent element:
$\displaystyle \sigma \,=\, \frac{R_n \,-\, R_{n+1}}{2L_n} \,=\, \frac{d_n}{2L_n}$
An LPDA is therefore fully specified by the two dimensionless constants $\tau$ and $\sigma$. The half-apex angle $\alpha$ is related to these parameters by
$\displaystyle \alpha \,=\, \arctan \left( \frac{1 \,-\, \tau}{4 \sigma} \right)$
Because the geometry repeats at intervals of $\ln(\tau)$, the antenna’s performance, including its input impedance and radiation pattern, oscillates periodically when plotted against the logarithm of the frequency. By carefully choosing $\tau$ and $\sigma$ (in this model, optimized for the 200–800 MHz range), these oscillations are minimized, resulting in a remarkably stable VSWR and gain across a 4:1 bandwidth.
Beyond the Ideal: Explicit Boom Modeling in AN-SOF
The LPDA boom, i.e., the transmission line feeding the dipoles, can be implicitly modeled using telegrapher’s equations (the standard equations of transmission line theory). In AN-SOF, these implicit transmission line models can be used to feed an LPDA, which is computationally inexpensive. A tutorial for connecting the elements of an LPDA using implicit lines is provided here:
This is a good modeling technique as a first approach. However, it ignores the physical reality of the boom as a radiating and coupling structure.
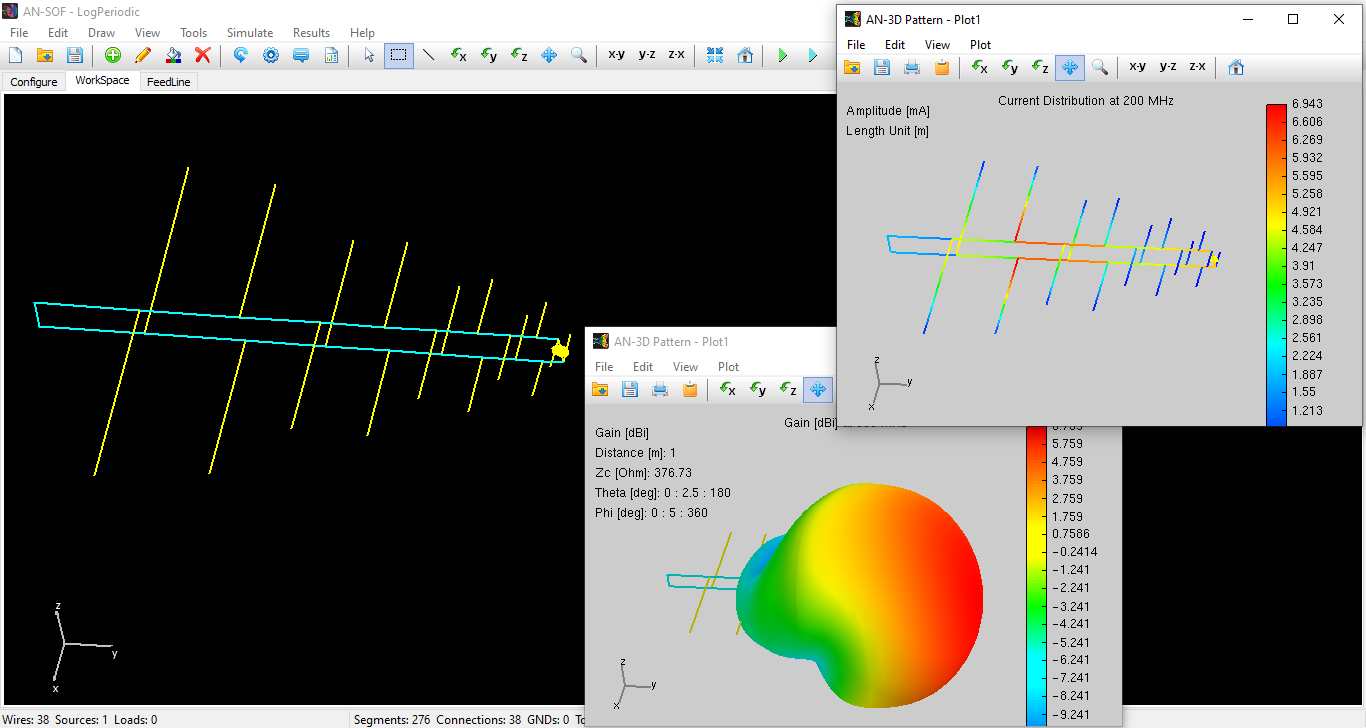
In this 9-element model, we have instead modeled the boom explicitly using wires (Fig. 2). This ensures that the Conformal Method of Moments (CMoM) solver accounts for the physical proximity of the feed line to the elements, providing a more accurate prediction of the antenna’s real-world behavior, especially at the higher end of the 200–800 MHz sweep.
Model Specifications:
- Element Count: 9
- Bandwidth: 200 to 800 MHz
- Longest Element: $0.75\text{ m}$ (Resonant near the lower cutoff)
- Shortest Element: $0.1258\text{ m}$ (Resonant near the upper cutoff)
- Feeding: Explicit wire boom with a $200\,\Omega$ reference impedance (simulating a 4:1 impedance transformer to a $50\,\Omega$ system).
Analysis of the “Active Region”
The magic of the LPDA lies in the Active Region. As the frequency increases, the cluster of near-resonant elements “moves” from the longer elements toward the shorter ones.

In Fig. 3, this shift can clearly be observed in the current distribution on the antenna. At any given frequency, only about three elements are actively contributing to the radiation, while the others act as directors or reflectors, or remain electrically inactive. This localized resonance is the reason the radiation pattern shape remains stable, as Fig. 4 shows, with a gain between 5.2 and 7.5 dBi across a 4:1 frequency range.
Performance Metrics
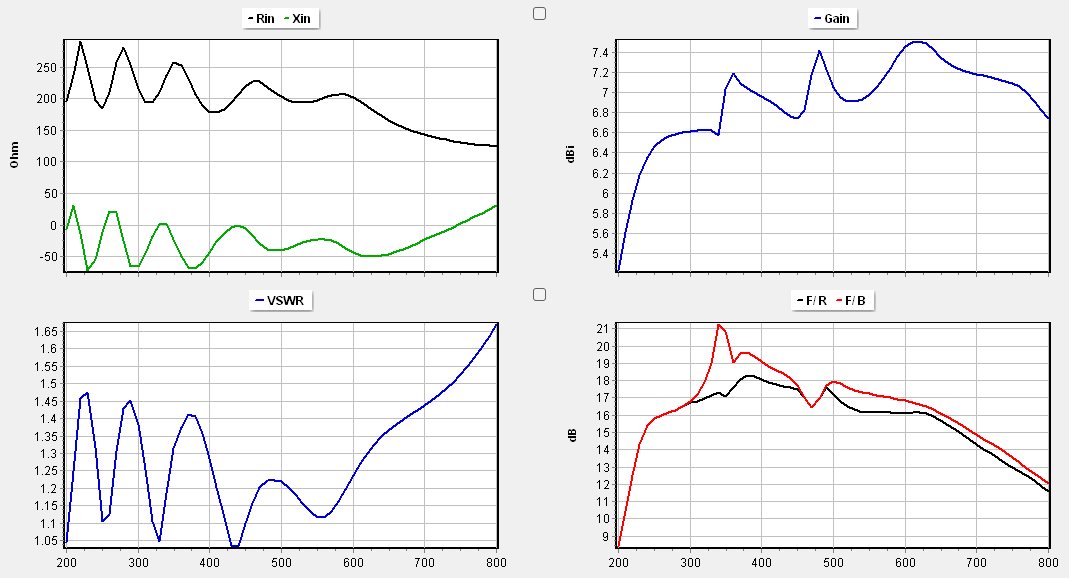
The simulation results confirm the robust nature of this design (Fig. 5):
- VSWR: Oscillates between 1.05 and 1.6, indicating an excellent match across the entire band when referenced to $200\,\Omega$.
- Front-to-Back (F/B) Ratio: Achieves peak performance of >15 dB between 300 and 700 MHz, maintaining high directivity before tapering to roughly 10 dB at the band edges.
Conclusions
The simulation of this 9-element LPDA within AN-SOF demonstrates that this type of antenna can be modeled completely using wires for both the dipole elements and the boom closely approaching real world engineering. By explicitly modeling the transmission line boom with wires instead of using implicit transmission line models, the complex mutual coupling and proximity effects can be accurately captured.
The results confirm that:
- Active Region Dynamics: The antenna successfully maintains an “Active Region” that migrates from the 0.75m element down to the 0.1258m element as frequency increases, ensuring consistent directivity.
- Impedance Stability: Referencing the system to $200\,\Omega$ effectively demonstrates how a 4:1 balun would stabilize the VSWR between 1.05 and 1.6 across the entire multi-octave range.
- Modeling Accuracy: The stable Gain (5.2–7.5 dBi) and high Front-to-Back ratio (>15 dB) calculated by AN-SOF’s CMoM solver provide a high-fidelity benchmark for physical prototyping.
See Also:
Technical Keywords: LPDA, Log-Periodic Dipole Array, Active Region, Explicit Boom Modeling, Wideband Antenna, VSWR, Frequency Sweep.