Search for answers or browse our Knowledge Base.
Guides | Models | Validation | Book
What’s New in AN-SOF 10? Smarter Tools for RF Professionals and Antenna Enthusiasts
We are excited to announce the release of AN-SOF 10, the latest version of our powerful antenna simulation software. Designed with the needs of RF engineers, ham radio enthusiasts, and academic professionals in mind, AN-SOF 10 brings a host of new features and enhancements to streamline your antenna design and analysis workflows.
This release focuses on improving both the data input and output interfaces, making it easier than ever to create, modify, and analyze antenna models. Whether you’re exploring example designs, optimizing transmission lines, or visualizing complex radiation patterns, AN-SOF 10 offers intuitive tools and enhanced functionality to support your projects.

Key highlights of this release include:
- Enhanced Workspace Interface: With the introduction of new wire selection tools and enhanced visualization options, navigating and editing your antenna models has never been more efficient. The new Models tab provides quick access to pre-computed example models, making it especially helpful for learning about antenna concepts and exploring design ideas.
- Tabular Input Window Enhancements: The new Trans. Lines tab and optimized simulation workflow ensure smoother data entry and faster simulations, while the Search and Replace feature simplifies large-scale wire edits, saving you time and effort.
- Advanced Data Output Options: New features like Export Currents, interactive Results table, and Smith Chart displays provide deeper insights into your antenna’s performance. Additionally, the ability to save plots as PNG images offers greater flexibility in sharing and presenting your results.
These updates reflect our commitment to providing you with a robust and user-friendly tool for antenna design and analysis. Whether you’re a seasoned RF engineer, a passionate ham radio operator, or a student learning the intricacies of antenna theory, AN-SOF 10 is here to support your journey.
We encourage you to explore the full details of this release in the notes below and take advantage of the new features to enhance your antenna simulations. As always, we value your feedback and look forward to hearing how AN-SOF 10 helps you achieve your design goals.
Happy simulating!
Tony Golden
AN-SOF 10 Release Notes
Enhanced Data Input Interface
Workspace Interface Upgrades
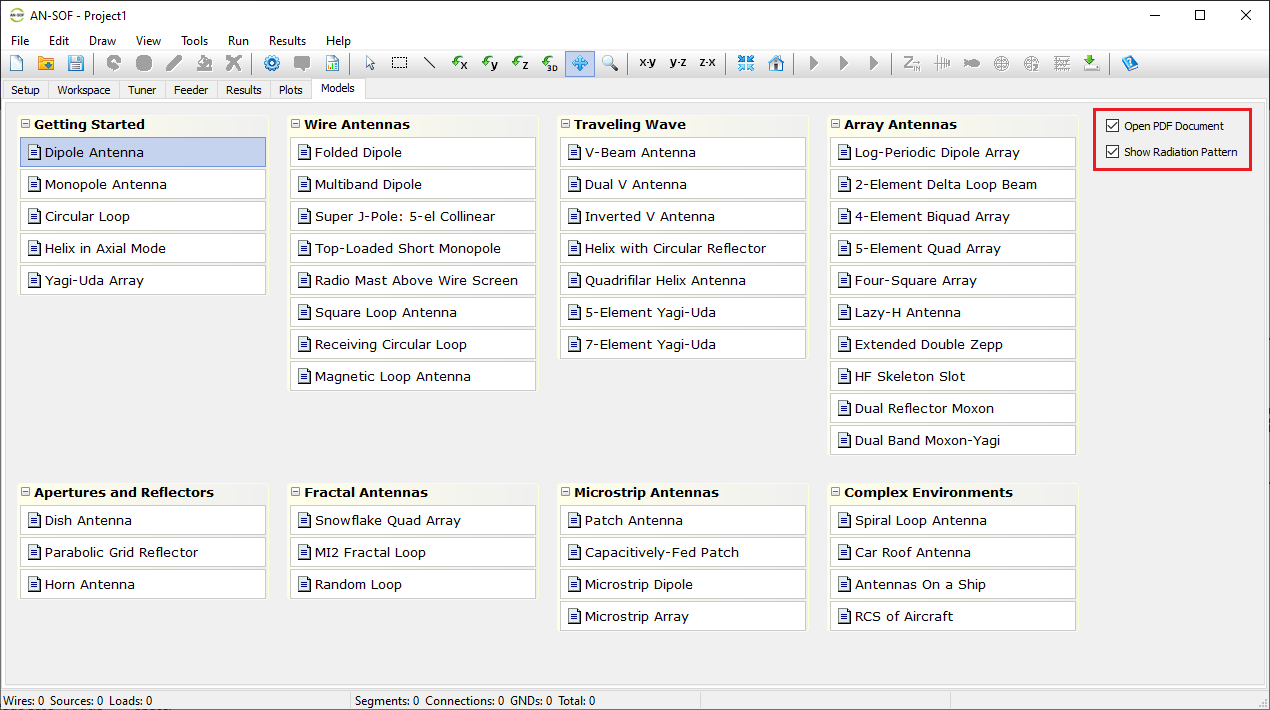
1. New Models Tab:
A new Models tab has been introduced, featuring quick-access buttons for opening example models, displaying 3D radiation patterns, and accessing PDF guides and informational resources. The models are organized into categories for easy navigation, making this feature particularly helpful for users exploring example designs and learning about antenna concepts.
2. Improved Multiple Wire Selection:
Wires can now be selected individually or in combination using the “Selection Box,” streamlining the wire editing process and enhancing usability.
- Click the Select Wire (arrow icon) or the Selection Box button in the main toolbar to select and edit multiple wires.
- Click the Select Wire (arrow icon) button and then select wires one by one by left-clicking on them while pressing the Ctrl key.
- With the Ctrl key pressed, click on a selected wire again to deselect it.
- Selecting multiple wires one by one can be combined with the Selection Box. Drag a box to enclose the wires to be selected.
- Dragging the selection box from top to bottom selects fully enclosed wires; from bottom to top selects partially enclosed wires as well.
- Double-click on the screen to deselect all wires or click the Home button in the toolbar.
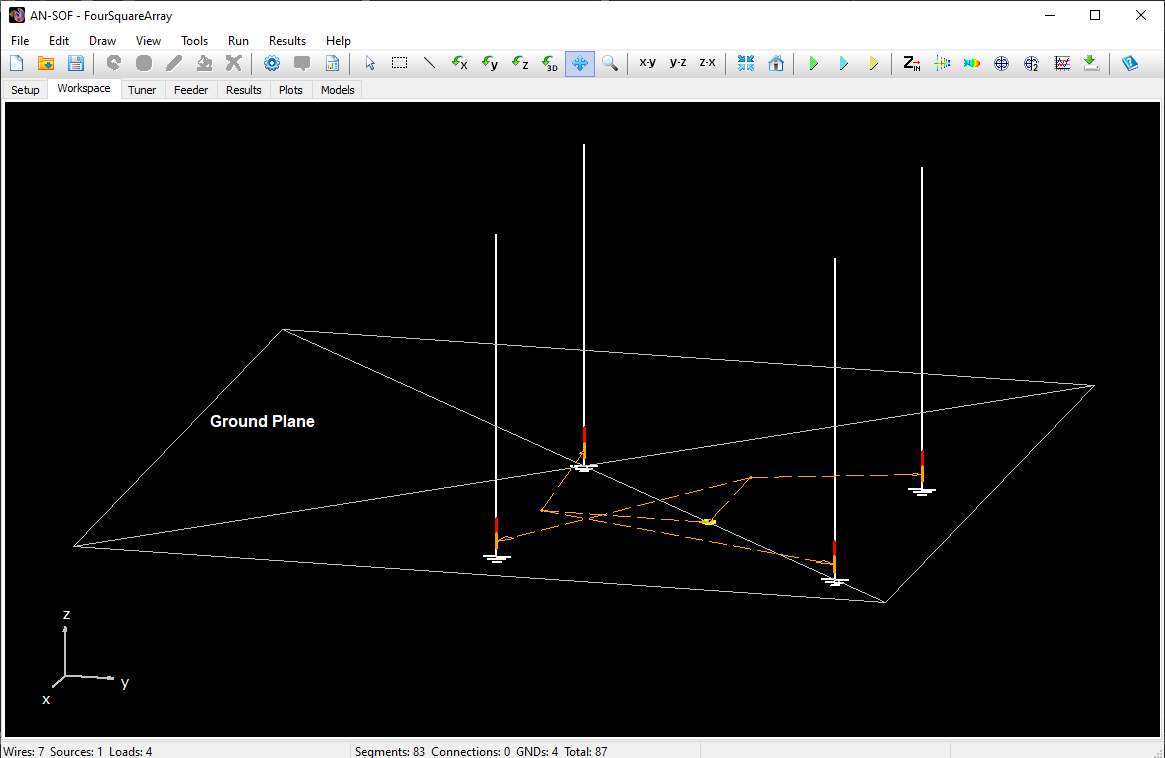
3. Ground Plane Visualization:
The ground plane is now displayed as a square with cross diagonals to enhance the visualization of its position. The ground plane symbol is also viewable in the AN-3D Pattern app.
4. Improved Zoom Functionality:
Zooming in and out using the mouse wheel or Ctrl + I/K is now more intuitive. When a ground plane is present, the wire structure zooms around wire positions instead of the coordinate origin.
5. Segments per Wavelength Calculation:
- When selecting multiple wires, navigate to Edit > Modify in the main menu. Specify a value for Segments per Wavelength, or enter “0” (zero) in the Segments per Wire field to automatically set the number of segments for each wire based on 10 segments per wavelength.
- The number of segments calculated for a wire will be the odd number immediately higher than that calculated for wires with a source.
- Wires with a source at their center will maintain the source at their center after changing the number of segments per wavelength.
- It is recommended to use a dedicated short single-segment wire to place the source, with the wire length equal to the actual distance between the antenna feed terminals where the transmission line (feeder) is connected.
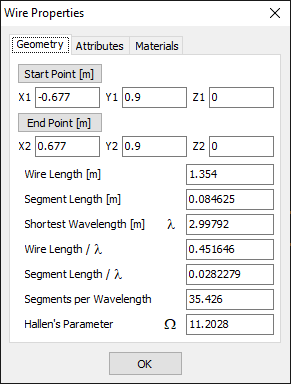
6. Wire Properties Window:
The segments per wavelength and Hallen’s expansion parameter “Ω” are now displayed within the Wire Properties window, providing more detailed wire data.
Hallen’s parameter quantifies the effect of wire thickness and is defined as Ω = 2 ln(L/a), where L is the wire length and a is the wire radius.
7. Transmission Line Transformations:
Transmission lines fully enclosed by the selection box will be transformed together with the associated wires when using the Move, Rotate, or Scale transformations in the Edit menu. This prevents transmission lines from being disconnected from wires selected via the Selection Box.
8. Wire Import Confirmation:
A confirmation window now appears when importing wires from a NEC file if wires are already present in the workspace, prompting users to either overlay existing wires or delete them before importing new ones.
9. Error Messages in Processing Window:
After completing a simulation, error messages will now inform users if a negative or zero input power is detected, or if radiated or lost power exceeds input power, highlighting potential model errors.
10. Save Prompt Optimization:
Users are now prompted to save changes only if modifications are made in the Setup or Workspace tabs. This greatly reduces the frequency of save prompts. However, we recommend users save their projects periodically and before closing AN-SOF.
Tabular Input Window Enhancements
1. Optimized Simulation Workflow:
- Opening and closing the Tabular Input window without making any changes no longer requires rerunning the simulation.
- Any changes made will prompt a rerun via Run menu > Run Currents (Ctrl + R), Run ALL (F10), Run Currents and Far-Field (F11), or Run Currents and Near-Field (F12).
2. New “Trans. Lines” Tab with Visual Feedback:
- A “Trans. Lines” tab has been added to the Tabular Input window.
- In this tab, you can add or edit a transmission line for each row in the table.
- Specify “Wire No.” (according to the numbering in the “Wires” tab) and “Position” (wire segment number) for each port (Port 1 and Port 2) to connect it to wire segments.
- The rest of the transmission line parameters (Z0, VF, Length, etc.) are the same as in the Transmission Line window accessed via Draw menu > Transmission Lines (Ctrl + L).
- Entering a zero in “Wire No.,” regardless of the “Position” entered, disconnects the port from the wire (putting the transmission line port in “FREE” status).
- Only transmission lines with both ports connected to wire segments will be considered in a simulation.
- Clicking on a row number (first column of the table) in the “Trans. Lines” tab highlights the transmission line in red in the AN-SOF workspace.
3. Enhanced Editing Options:
- Right-click on the transmission line table to display a pop-up menu with options: Cut (Ctrl + X), Copy (Ctrl + C), Paste (Ctrl + V), Insert (Ins), Delete (Del), and Clear Contents (Ctrl + Del).
- These options can be used to edit cells or rows, similar to the other tables in the “Wires,” “Source,” and “Loads” tabs.
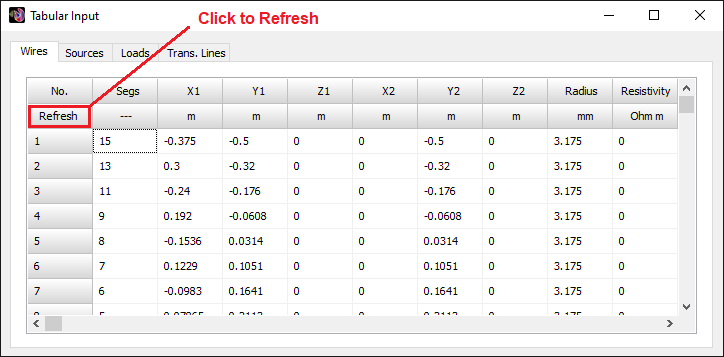
4. Refresh Button:
A “Refresh” button has been added to the Tabular Input window to instantly apply changes, eliminating the need to close and reopen the window.
5. Unified Unit Entry:
Load inductance and capacitance values must now be entered in the same units as set in the Preferences window, ensuring consistency across the application. Previously, inductance was entered in Henries and capacitance in Farads.
6. Search and Replace Feature:
The “Search and Replace” option in the Wires table’s pop-up menu within the Tabular Input window allows for massive edits to wire end coordinates.
Enhanced Data Output Interface
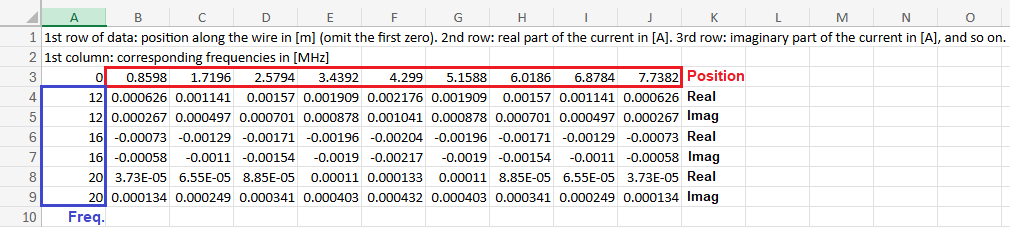
1. Export Currents Option:
- Added to the Results menu to export the current distribution (real and imaginary parts) along a selected wire as a function of frequency in a CSV file.
- How to use: Click the Select Wire (arrow icon) button in the toolbar, left-click on the wire, then go to Results menu > Export Currents.
- The complex current is tabulated based on position along the wire. Position and frequency units are chosen in the Preferences window.
- Position is measured from the start point of the selected wire (end displayed without the arrow when selected).
- Table format example provided:
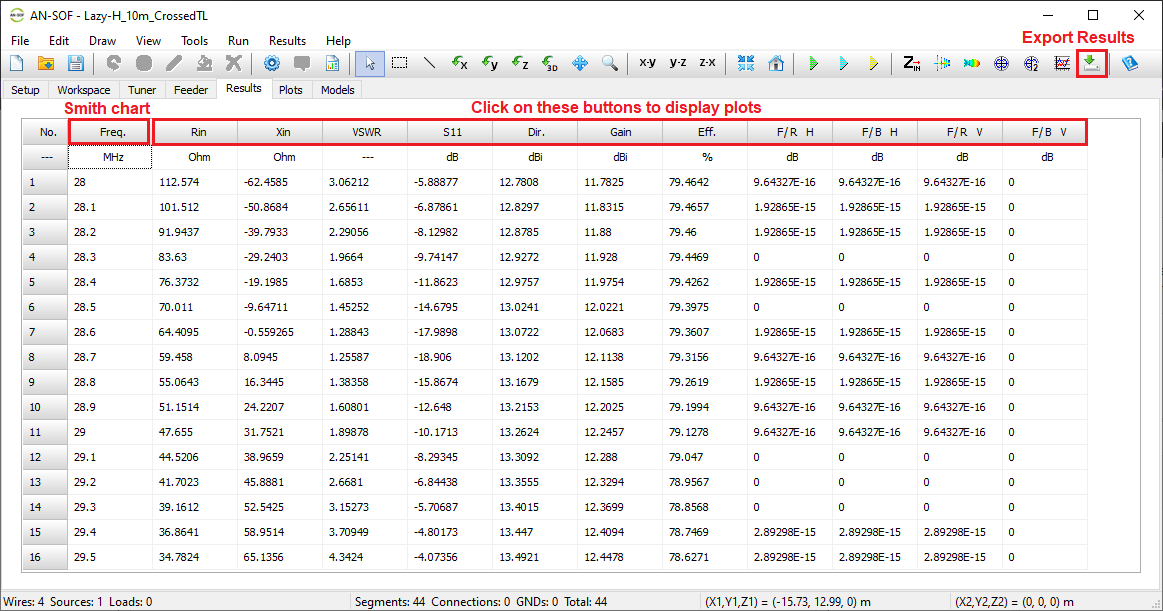
2. Interactive Results Table:
- Clicking the header buttons Rin, Xin, VSWR, and S11 in the table in the Results tab plots the content of their respective column.
- Go to the Plots tab > Zin box and choose between Antenna, Feeder, or Tuner.
- Then go to the Results tab where Rin, Xin, VSWR, and S11 will be tabulated at the antenna, feeder, or tuner input.
- Click the header buttons to plot these results.
3. Smith Chart Display:
- Go to the Results tab, and click the “Freq.” header button in the table to display a Smith chart where impedance is plotted using columns Rin and Xin.
- This allows the feeder or tuner input impedance to be displayed in a Smith chart.
4. FRX Format Export:
Users can now export input impedance vs. frequency data in FRX format within the AN-Smith app. Navigate to AN-Smith main menu > File > Export, and select the “FRX Format (*.csv)” option to save the data, with frequency in MHz, resistance in Ohms, and reactance in Ohms.
5. Save Plot as PNG Option:
- Added to the File menu of AN-3D Pattern, AN-Polar, AN-XY Chart, and AN-Smith applications to save the displayed plot as a PNG image in the user-selected folder.
- This option replaces the discontinued “Print” option.
- A “Save Plot as PNG” button is provided in the toolbar.
Resolved Issues and Bug Fixes
- The AN-Key app had an issue where the license file wasn’t saved in the correct location, preventing software activation after entering the activation key. This is now resolved.
- A floating point error was displayed when entering a frequency with a zero integer part in the Frequency panel of the Setup tab. This is now fixed.
- Resolved issues in the Tabular Input window related to changing source and load types.